Dow Intraday Charts 20 Jan - 23 Jan

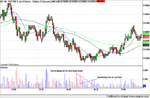
BG – The triangle height is circa 45, so with a support line at 10615, we could be looking at 10570, but it might not deliver – as OES says, the other indexes appear to be pulling off their lows...

Mr B – a question for your active mind – was Fibonnaci a relative of Liberace? – I’ve often wondered….. :confused:

edit - pulled short at 625 - bulls win! (for now) - might have another go if it weakens later....quite often targets are delivered by a 'indirect' route....!
 
Last edited:
One eyed shark, i am just trying to get hang of es div.
I see div on 1 min chart between 16:15 and 16:19 also 5min div from 16:15 to 16:40.
Is that what you see

thanks
 
Anmol

On the 1 min chart you are correct , high down bar volume at c 16:15 followed by contracting volume on down bars all the way to 16:30.

In this case accompanied by increasing volume on the up bars, though this is not essential it re inforces the potential bottom

I don't trade off 5 min charts though I assume that the divergance would provide just as a clear a signal, maybe CM can clarify later.
 

Attachments

  • snapshot-2.jpg1.png
    snapshot-2.jpg1.png
    72.6 KB · Views: 396
Thanks m8, it all helps.
ALso noticed that es pivot point acted as support.
Just a question, why not use ym vol div, is it because there isn't as much vol in ym compared to es and therefore unlikely to be very accurate.

thanks

Nb
sorry another question, is 1min vol div more accurate than 5/10min div
 
The way I understand it anmol and I can be corrected on this one, the volume reported by CBOT on the YM does not include every trade, whilst the volume on ES is accurate.

Also ES is much more widely traded and will iron out volume spikes while YM volume is still relatively thin.
 
Not often you see this

H & S followed by a inv H & S all around 32. :cheesy: :cheesy:

Thats me done for the day have a good one
 

Attachments

  • snapshot-2.jpg.png
    snapshot-2.jpg.png
    50 KB · Views: 310
I think all volume is reported on YM now that it has moved from ACE to ECBOT, isnt it?

YM volume is regarded as a waste of time I think because its just much much lower than ES, most of the pros and larger brokerage houses using ES.

At least thats what I'm led to believe...
 
Clear now - a long consolidation triangle in the making - just making small trades now in both directions until a break occurs.

Two touches on the top line so far, so maybe we'll see a third........becoming very choppy!
 

Attachments

  • 22-01-04a.gif
    22-01-04a.gif
    13.8 KB · Views: 282
What's an Elliot Triangle?
ES Volume.
1) I only take note of 1 min vol.
2)I only look at if if I want secondary confirmation of a bottom.
3)I know very little about ES vol- ask Skim.
4) when ES vol ( buy and sell) forms a tend line heading for zero vol, expect a big move. Checkout 19:08 to 19:30 on ES!!! Get the direction right and it's in the bank.
 
little chart to try and illustrate the concept.

it doesnt forecast the market -

what happens at the apex is often important.
 

Attachments

  • neck.gif
    neck.gif
    3.6 KB · Views: 344
that sort of issue is best analysed using market profile,imo

markets don't respond to predetermind times and dates
(well not usually)
they move when the big players come in/out or locals get tired ?

but they will be watching this move.

(might even finish up being a flag at half mast - but that is only conjecture)
 
OK Got that. Just a "regular" triangle. WRT the Dow, short term triangle work well, conforming to general TA. These long drawn out ones are broadly irrelevant and unpredictable. You need to look at these on the 10 min chart to form a view,as you often get a different picture. The short term ones last 60 - 90 mins( ish) and they don't always break as one would expect from the theory. A clue can often be had by looking at the last cycle, looking for a failure at resistance or support, the break going in the direction of the failure. So, if the last peak fails to make the resistance trend line,expect a drop through support.... This "feature" can also be picked up on RSI, even though the price makes support or resistance.
 

Attachments

  • triangles.gif
    triangles.gif
    4.6 KB · Views: 222
Looking at this onthe 10 min chart,the last trough has failed support.....and it is distinctly a flat bottomed triangle.
 
From last light, the minimum expected move was to 667. It only made 660 and spent the rest of the day sideways. Dificult to see where this is going. Over to TS :cheesy:
 

Attachments

  • dow 22-01-04 10.gif
    dow 22-01-04 10.gif
    27.5 KB · Views: 485
What a messy day. Best left alone.... :(
It'll take some effort to get to my target of 764.
 

Attachments

  • dow 22-01-04 1.gif
    dow 22-01-04 1.gif
    27.8 KB · Views: 500
sorry, been watching the Atkins diet - fascinating !

not at all sure what a 'regular' triangle looks like. People seem to call just about anything a triangle these days ?

elliott triangle looks like this.
May not yet be complete, depends if E has finished.

Suspect we saw overshoot, not undershoot ?
 

Attachments

  • triangle.gif
    triangle.gif
    10.2 KB · Views: 482
Last edited:
Top