Dow Intraday charts 15 Dec - 19 Dec

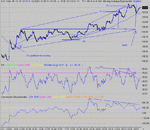
Another mostly uneventful day until the final session, with the 7pm trade doing well.Breaking out of the triangle on a slope change , then the pullback to support line before setting off for 132 that I called in the chatroom. Two choices of an out, if you needed it, the first peak at 137, the next at 35, both showing 3 pk ND. As it turned out, it was a tricky affair at the close, being decidedly awkward about which way to turn.... first it looked like a close at HOD, then a tank into the close... In the end , neither, closing short of HOD.
Good example of the triangle breakout theory that says the target should be met at, or before the apex.
 

Attachments

  • dow 16-12-03 1.gif
    dow 16-12-03 1.gif
    26.2 KB · Views: 505
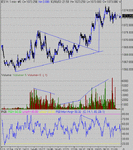
Nice example of a breakout on volume on ES.....
 

Attachments

  • volume bo.gif
    volume bo.gif
    25.5 KB · Views: 520
Is/was this a bearflag targetting magic 64?
CM, really liked your ES volume s=chart. Is ES now dropping on rising volume?
 
I didn't notice any bear flags yesterday.... ES vol today is similar to yesterday... I don't think there is a relationship between yesterday's vol/ price to today's vol/price.....
 
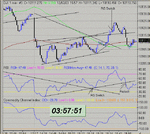
I meant: Can the current pattern after the lower open be looked at as a bear flag. As I write this DOW again bounces off suport line.
 
Yes it can, but opening TA is quite often suspect so care is needed in trading a particular pattern in the first 30 or so.- Different if there has been NO GAP. Don't forget the dow is bullish....
In fact there is already a sign of channel failure in that the last low failed to make support at 10105.....
 
CM, I am sorry I do not fully understand.
Would you mind posting a chart?
 

Attachments

  • image1.gif
    image1.gif
    48 KB · Views: 457
Where to?
It's driving me nutty. I just realised there's a 30 odd point range and 20 of that was the opg :rolleyes:
 
Oatman, you are taking words out my mouth: Drives me nutty too!

What kinda pattern is this? I saw some RSI ND's. Now we see some lower lows and lower highs. Now 3 or 4 tops, that is if the last rise reverses.

ES broke out of its distinct channel albeit typical late morning little volume?

Who helps shed some light?
 
Defies analysis.. Sit and wait. Do some knitting....Play hide and seek with yourself...... :cheesy:
As I speak, triangle on RSI may turn up something...@ 60
 
Well, after two days of big moves and high excitement, perhaps we were due a boring rangebound day.... :(

As we seem to have a lot of overhead resistance at current levels, I was thinking that we might have a small tank to 10080 ish followed by a bounce back to finish marginally in the red...

Any other offers...?!? :)

I reckon that if they catch Bin Laden Claus overnight, we might have a rally that will put the Saddam Claus rally in the shade.......

We might be able to sell the news from about 10275....

Any other offers...?!? :cheesy:
 

Attachments

  • binladenclaus.jpg
    binladenclaus.jpg
    17.3 KB · Views: 578
A pause at yesterdays' high or double top?

Having cut my short at 88 (YM), I was sleeping at switches )in fact putting kids to bed, an expensive activity).
Pretty obvious, in hindsight, that the test of yesterdays' high was going to be resistance.
So what's next? Strictly speaking I don't see RSI ND, more up volume in both ES and YM and as CM puts it "Don't forget the dow is bullish....". CM, you were right once again.

So unless dow makes clear break away from the 100ema, i'll stay flat.
 
Thanks for the info Bgold, I'll try not to be short when Bin gets binned, it'll blow my stop for sure... :eek:

on reflection, I think that 'Osama Claus' has a better ring to it....... :cheesy:

ps - we now seem to have seen resistance for a triple-top around 10137 - if (when?) it breaks through this level we will see a powerful rally imho.........

I suspect that they are still trading the perceived 'Santa Rally', so the line of least resistance is up (until Boxing Day?.....!) barring any bad news.

edit 20.57 - 10200+ here we come before Xmas!!
 
Last edited:
What a horrid day to trade, only made slightly better because I trade futures and it is much easier to scalp.

Can't see how you spreadbetters out there could have found many oppotunities to grab some points, one trade at 18:30 with the bounce off 10100 maybe, apart from that ???.

Here's to a bit of volatility tommorrow :D
 
Mr Shark - a confusing day for sure.....! :confused:

only two trades for me:- short from the ND top at 10125 - 10098 (I thought it would go to 10080.....)

then long at the 3 peak PD bottom at 10105 - 10035 ND top...

I didn't see the last leg up to 10145 coming at all......... :(

futs now up to 10166 - 10200 here we come, and soon imho...!

ps - triple-witching alert Friday....... :devilish:
 
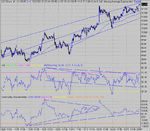
Staying in channel and 'movin on up'. Nothing more. Is that really 7 day's of divergence on RSI? Or is it negated by all the lows? Pass....
 

Attachments

  • dow 17-12-03 10.gif
    dow 17-12-03 10.gif
    33.8 KB · Views: 266
Top