Best Thread Debunking Fibonacci's Code...

Making a case for Fibonacci.
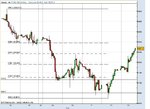
Dow jones on the 25/02/07 looked good (Similar to Nikkie of last post)with two waves beginning of third,Doji followed by Hammer
and Emas 4&15 about to cross.Also Momentum Indicators had switched on each previous wave. Decided to wait until EMAs crossed and Momentum indicators switched.
Updated Data today on Dow Jones Industrial(Yahoo) and large drop.
So to Fibonacci,Today 27/02/07 (is now 12.40am just trading in USA 28/02/07) Fibonacci is still around 12529, My momentum indicators are still yet to switch(and red). My adjusted Fibonacci at 50% is near 12380.
If I was forced to trade I would take 12380 as my target over 3 days.Close once reach,conservative.
Without the momentum switch(Being ROC fibonacci) I would prefer to wait.
Case for Fibonacci
 
Last edited by a moderator:
Now the 2/3/07. Fibonacci down to around 12380 , which happens to be the original 50%. I am looking at a Bearish Gartley pattern that interests me in the application of Fibonacci ratio's.(Or , primes which ever way you look at it)My reverse Momentum Indicator switched on
the 28/02/07(it didn't pickup the previous waves)My forward Momentum Indicator is yet to register , so I don't know whether there is a switch. I would say that a side ways movement could eventuate on the next trading session.
 
Last edited by a moderator:
Now the 4/3/2007. Looking at my last post. I probably did not do justice to the application of Fibonacci.
I will in future give ranges if I think the indice is trending . I would not have made money out of a Side ways
movement but that is prehaps my incorrect analysis rather than a fault in the methodology of the analysis.
With the appearance of a backwards switch ,Big gaps on the EMAs ,and negative trend. The factoring in of a negative trend similar to the High Low range of 20/02/07 12122 -> 12396 was indicated.
The range down of a 50% fibonacci adjusted was 12089.
There is now a forward switch and the Fibonacci is at the same point as the last trading day.
I would not be happy trading this switch until more indicators show up. Preferably in the day after the next trading day.

Rather than monopolising this great discussion of Fibonacci I will start a new Thread with predictions from the testing of my program.(If I see anything interesting).

I think I have shown in the previous posts that Fibonacci can be a handy tactical tool when applied with Finesse.
 
This seems like a good thread to put my Fib query.

It seems that the usefulness of Fibonacchi does not, completely, convince. My current interest in it stems from TD's Making Money Trading thread, which deals with pins.

Much interest has been aroused on the Fibs subject, on that thread, and I decided to try it out to see what would happen. I was looking for a retracement, but every one of the Fibs lines was passed on the up.

Well, that was OK, I was using a trendline, anyway, but I enclose my chart to see if there was any clue of which percentrage line to use. For the life of me, I cannot see one.

My question is. If we are in a downtrend, what significance does Fibs have for signalling the end of a reversal? This is a 60 min chart. Maybe it's wrong to use that timescale but, with the ease with which the price went past all the other %age lines, it may well do the same with all the others. I'm, personally, paying more attention to the resistance, than the Fib at 61%.

If anyone can give me some insight as to how this chart should be interpreted, I'd be grateful.

Split
 

Attachments

  • FT23rdNov2007hourly.JPG
    FT23rdNov2007hourly.JPG
    62.2 KB · Views: 333
This is just my view Split.

There are a number of forms of support and resistance. The best is horizontal (prior swings of support and resistance. Then there are, in no particular order, trend lines, parallel trendline channels, moving averages and fibs.

Normally I will only limit in at support if the main trend is intact and I get more than one form of s&r in agreement (so say, the fib and horizontal agree or the horizontal comes at the mas). Exceptionally enough things at one point might encourage me to limit in when the main trend was broken.

In this case I perceive the main trend to be broken so I would wait for a test of your fibs and a price signal like a pin bar before I went short. My personal preference when faced with a situation like this is for a test and then a retest (aka a double top at that timescale) but I don't trade ftse and I've found the "right type of price action" to vary a bit between tradables.


Note: I don't believe that anything including fibs has magic. I just believe that if enough people watch and trade around things then its worth taking advantage of their activities.
 
This seems like a good thread to put my Fib query.

It seems that the usefulness of Fibonacchi does not, completely, convince. My current interest in it stems from TD's Making Money Trading thread, which deals with pins.

Much interest has been aroused on the Fibs subject, on that thread, and I decided to try it out to see what would happen. I was looking for a retracement, but every one of the Fibs lines was passed on the up.

Well, that was OK, I was using a trendline, anyway, but I enclose my chart to see if there was any clue of which percentrage line to use. For the life of me, I cannot see one.

My question is. If we are in a downtrend, what significance does Fibs have for signalling the end of a reversal? This is a 60 min chart. Maybe it's wrong to use that timescale but, with the ease with which the price went past all the other %age lines, it may well do the same with all the others. I'm, personally, paying more attention to the resistance, than the Fib at 61%.

If anyone can give me some insight as to how this chart should be interpreted, I'd be grateful.

Split


Split

As you know I trade potential trend continuations via 3+ bar retracements.

In the early days, for around 200 trades, I included in my post trade analysis the fib level where the retracement appeared to have finished (ie: a potential swing low/high created). There was no significant correlation EXCEPT that the prospects for the trade were better when the retracement ended before fib 50% was reached. That's before fib 50% not at fib 50%.

Make of that what you will :cheesy:

good trading

jon
 
We have a good example, I think, on my chart, of an impending reversal at the 61% level, I see resistance there and that is what I am taking notice of, more than Fib.

As you say, a lot of people take notice of these signals and that is what gives them added significance. So those who swear by S/R added to those who swear by Fib are going to be a powerful group to reckon with. You could say that the optimists and the pessimists of both groups are going to meet head on.

That is, of course, if my Fib line has been drawn correctly. :confused:

Split
 
Fib"ys and other entries

We have a good example, I think, on my chart, of an impending reversal at the 61% level, I see resistance there and that is what I am taking notice of, more than Fib.

As you say, a lot of people take notice of these signals and that is what gives them added significance. So those who swear by S/R added to those who swear by Fib are going to be a powerful group to reckon with. You could say that the optimists and the pessimists of both groups are going to meet head on.

That is, of course, if my Fib line has been drawn correctly. :confused:

Split

Hi Split

Fib = illusion of control = reason for entering the market = is it a valid reason :?:

yes if money management and R&R worked out in advance and price movement after entry confirms the line drawn on the chart

If it does"nt work out then bail out quick and draw another line :LOL: :LOL: :LOL:

IMO much the same as a trend line, asking the price to walk down the line is asking a bit much of price,

errrrrrrrr is"nt it, :?:

keeps you in trade if it keeps to right side of it and alerts you to trade entering shallow water :LOL: :LOL: so a good simple visual tool that works and alerts you to a potential change to market conditions. potential

IMO all entry methods are pretty much as good as one another,

Hell I have tried them all, :eek: :eek: and just ended up back at the beginning before I improved by as much as one tick. :LOL: :LOL:

Its the mistakes we make once in that will make the difference and nothing else Split.

barjons method, I am familiar with and it is my favorite signal/method for reading and judging the short term trend (days), it works on all time frames BUT :eek:

you have to learn it - like it- and most important identify a false or failed signal ASAP, same applies for any other method / signal IMO

A black box can enter trade after trade and no problems BUT the trader must no the limitations of the program that is running hence sh..t trader will not pull plug on the black box when methods not working, much the same as a trader entering shorts because tthe main trend is down but the market is trending long today, daft but easy to do if not experienced. I have done it, its the only way to learn not to do it and identify a trend day live, not some pic"ys out of some trading book.

After a couple of years, you will have made entry and method yours and ~

:D :D Happy days

same with fibs I guess and anything else

reseach it, try it,(DEMO) if you like it, use it.

But do not expect a Holy Grail because that to nick some one elses words on another thread is between your ear holes :LOL: :LOL:

Happy trading all, barjon I no your having FUN :cheesy:

Andy AKA
 
develbis;372158 keeps you in trade if it keeps to right side of it and alerts you to trade entering shallow water :lol: :lol: so a good simple visual tool that works and alerts you to a potential change to market conditions. [B said:
potential[/B]

IMO all entry methods are pretty much as good as one another,

Well, well, well. Look who's here. :) I'll have to watch my p's and tl's now. :D

The thing about Fibs is that it leaves you to decide whether to jump up or down and that is something I knew how to do, already.

A trend line only helps me to decide whether to stay in the trade, or not, but that, in itself, is one useful piece of information.

No, Andy, I've never been a follower of Fibs. Just looking into it, seeing that it is part of the p-bar curriculum.

Split
 
We have a good example, I think, on my chart, of an impending reversal at the 61% level, I see resistance there and that is what I am taking notice of, more than Fib.

As you say, a lot of people take notice of these signals and that is what gives them added significance. So those who swear by S/R added to those who swear by Fib are going to be a powerful group to reckon with. You could say that the optimists and the pessimists of both groups are going to meet head on.

That is, of course, if my Fib line has been drawn correctly. :confused:

Split


different markets have different relationships, the essence of reading a market is to undestand the players involved that said the instrument they are participating in also gives one clues of intended actions and reaction.
As some of you know i dont think much of fib as a stand alone mechanical form that will forcast potential turning points, that IMO is a static method with very little foundation to achieving an objective. so really if one is to apply fib as a tool one has to change their perception of what fib really is.
basically a move up or down retraced or expanded is a mathematical representation of previous moves. now you may well say that is nonsense i assure you if you look closely you will find my statement to be correct
therefore for one to know where a market is going one must know where it has been
and why.

regards
 
With out understanding Elliott Wave structure fibs can not be used correctly imho.

It seems people mainly focus on simple wave retracements ratio's but have no idea of the current wave cycle which greatly effects which fibbonacci ratios come into play.
For Example, if the market is in a larger degree Wave 4 correction , then 23.6 % 38.2% are going to be far more relevant that the higher 61.8% or 78.6% ratios.

Understanding Corrective Elliott Patterns will greatly improve the use of Fibs.

Lets take the 2 basic types of Elliott corrections,The sharp Zig-Zag & the Side Ways Flat pattern.Both patterns are made up of 3 waves labeled an A-B-C, either could make up our larger degree wave 4 example.:)

In the Zig-Zag, the lower fibnonacci ratios are far more important when measuring the B wave rectracement against the proceeding A wave, with 38.2% being the most favored.

In Flat patterns, the B wave rectraces most of the proceeding A wave ( ie greater than 50%) so the Higher fibs come much more important.

Lets take traingle patterns.. Again the Higher fibs come into play as normally the two waves will relate to their proceeding waves by 61.8% or 78.6%.

In Elliott we do not use just Fibs isolation. Relationships between Alternate waves or wave lengths unfolding in the same direction are far more precise and reliable.
The Measured Move (1:1) would be a classic example of what Alternate wave ratio's are. We also combine these alternate wave ratio's with Fibonacci ratio's.

Again lets go back to our Wave 4 example .
We know Wave 4's like the lower fibs with 23.6% & 38.2% being the classic ratio's. We also Know that a Flat or Zig-Zag has the 3 wave A-B-C . The Alternate waves are A & C in this case.
When these two measurements combine we get the completed higher degree pattern. C will be a ratio of A into a classic lower fibbonacci ratio.

The two methods of measurement go hand in hand.

If people just start to measure fibs from any old swing point with out regard to the current market wave pattern, they are just gambling on which fib ratio might be the right one & 9\10 times they'll be wrong.
 
Split

As you know I trade potential trend continuations via 3+ bar retracements.

In the early days, for around 200 trades, I included in my post trade analysis the fib level where the retracement appeared to have finished (ie: a potential swing low/high created). There was no significant correlation EXCEPT that the prospects for the trade were better when the retracement ended before fib 50% was reached. That's before fib 50% not at fib 50%.

Make of that what you will :cheesy:

good trading

jon

Thanks, Jon. I'll watch that.

Split
 
With out understanding Elliott Wave structure fibs can not be used correctly imho.

It seems people mainly focus on simple wave retracements ratio's but have no idea of the current wave cycle which greatly effects which fibbonacci ratios come into play.
For Example, if the market is in a larger degree Wave 4 correction , then 23.6 % 38.2% are going to be far more relevant that the higher 61.8% or 78.6% ratios.

Understanding Corrective Elliott Patterns will greatly improve the use of Fibs.

Lets take the 2 basic types of Elliott corrections,The sharp Zig-Zag & the Side Ways Flat pattern.Both patterns are made up of 3 waves labeled an A-B-C, either could make up our larger degree wave 4 example.:)

In the Zig-Zag, the lower fibnonacci ratios are far more important when measuring the B wave rectracement against the proceeding A wave, with 38.2% being the most favored.

In Flat patterns, the B wave rectraces most of the proceeding A wave ( ie greater than 50%) so the Higher fibs come much more important.

Lets take traingle patterns.. Again the Higher fibs come into play as normally the two waves will relate to their proceeding waves by 61.8% or 78.6%.

In Elliott we do not use just Fibs isolation. Relationships between Alternate waves or wave lengths unfolding in the same direction are far more precise and reliable.
The Measured Move (1:1) would be a classic example of what Alternate wave ratio's are. We also combine these alternate wave ratio's with Fibonacci ratio's.

Again lets go back to our Wave 4 example .
We know Wave 4's like the lower fibs with 23.6% & 38.2% being the classic ratio's. We also Know that a Flat or Zig-Zag has the 3 wave A-B-C . The Alternate waves are A & C in this case.
When these two measurements combine we get the completed higher degree pattern. C will be a ratio of A into a classic lower fibbonacci ratio.

The two methods of measurement go hand in hand.

If people just start to measure fibs from any old swing point with out regard to the current market wave pattern, they are just gambling on which fib ratio might be the right one & 9\10 times they'll be wrong.

I've gone from pin-bars, to Fibonacchi. Now you want me to start on Elliot? :)

OK, it's Sunday tomorrow.

Split
 
:D

People are doing a disservice to themselves, if they are try to use Fibs in isolation. It also give fibs a bad reputation for being trading tool due to peoples "gambling" style when trying to pick a random fib as a turn point. :(

The Elliott Wave Principle by Frost & Prechter would pass a quite Sunday afternoon on quite nicely...:)
 
always use both a Correction/Retracement fibo and an Up/Down Projection fibo on the
trend/wave
the reason to do so relates directly to the question — "which percentage line to use" —
ie one doesn't 'know' what the Price will do so work with targets

often, but not always, the fibo level/s the Price - W2 - C/R to is the same higher ratio
levels the Price will break at — ie 'reverse', sometimes using the original fibo, sometimes
using a stepped fibo placed on - usually - the H/L C of the W2 C/R

what can be a problem is determining which is the correct 'wave' to measure
is the particular Price formation a W 0-1 or a Reversal formation, as could be debated
with the FTSE Oct - Nov formation

.

fibos don't work in and of themselves as others have pointed out and remain a tool of
personal preference, see: 'fibos.pdf' — 'Measuring the Unmeasurable'
http://www.trade2win.com/boards/showthread.php?t=25425&page=2
 

Attachments

  • ftse.png
    ftse.png
    21.3 KB · Views: 409
Another theory that attemps to show TA doesn't work.

That's why these guys are writing papers.

And I'm making money.
 
Another theory that attemps to show TA doesn't work.

That's why these guys are writing papers.

And I'm making money.

No one is saying that TA doesn't work, TD. TA is not 100% Fibonacchi, though, and there are plenty of successful traders who use TA, but not Fib.

Now, you have told me that P-bars have to be used in conjunction with Fibonacchi, or some other R/S method. You use Fib, so I have come here to put forward my problem with it, so that I do not clutter up your thread. My problem is that I cannot identify, correctly, the %age level to use. It seems I shall have to determine, properly, the strength of the price reversal. This is, more or less, like throwing a ball into the air. How high it goes depends on the strength of one's arm.

Now it depends, also, on a knowledge of Elliot Wave. All of these methods seem to rely on one another so, I think that I will go back to my own assessment of where the support/resistance of a price should be, which I have been using until now.

However, whatever I use, it will be a form of TA and I hope to be better able to spot and understand your pin bars when I read your posts in the future.

Regards

Split
 
Time is precious

Another theory that attemps to show TA doesn't work.

That's why these guys are writing papers.

And I'm making money.

Time is precious. Imho, it is not worth arguing about whether TA or Fib or EW works or not. People would have already made up their minds before coming to the table and in most cases, will refuse to be persuaded otherwise.

There are many ways to make money in the markets depending on a trader's personal convictions, risk tolerance, time horizon and account size. Depending on how one applies a particular method - although the "correct" application thereof is often not the way that many methods are widely taught - it is possible to make money using almost any method, as long as there are well defined risk parameters and timeframes.

I work in the city implementing derivatives trading systems and technology, straddling the lines between the derivatives traders, the pure Quants and the IT department. My formal training is in Mathematical Economics and Financial Econometrics. Over the past 11 years, I have conducted extensive research on a plethora of trading strategies both common and not-so common, and have used my own money to test most of these. I found that there is merit in almost all strategies when applied with a bit of creativity!

My conclusion is simple: one person can find a way to profitably - and most time unconventionally! -use almost any indicator/method, whilst another person can lose money applying the same indicator/method in a conventional manner.

Would what perhaps be more useful would be for Fibonacci exponents to share the ways in which they use Fibonaccci profitably, EWavers could do the same, and anti-Fibo or anti-EW protagonists could share the ways in which they use other TA methods, and anti-TA traders could share the ways in which they use Fundamental anaylsis profitably.

Those who are against a particular methodology could ignore the threads/topics on those methodologies, while spending more time contributing to the threads/topics of interest to them.

Time is too precious to be spend arguing and debunking imho.
 
With out understanding Elliott Wave structure fibs can not be used correctly imho.

It seems people mainly focus on simple wave retracements ratio's but have no idea of the current wave cycle which greatly effects which fibbonacci ratios come into play.
For Example, if the market is in a larger degree Wave 4 correction , then 23.6 % 38.2% are going to be far more relevant that the higher 61.8% or 78.6% ratios.

Understanding Corrective Elliott Patterns will greatly improve the use of Fibs.

Lets take the 2 basic types of Elliott corrections,The sharp Zig-Zag & the Side Ways Flat pattern.Both patterns are made up of 3 waves labeled an A-B-C, either could make up our larger degree wave 4 example.:)

In the Zig-Zag, the lower fibnonacci ratios are far more important when measuring the B wave rectracement against the proceeding A wave, with 38.2% being the most favored.

In Flat patterns, the B wave rectraces most of the proceeding A wave ( ie greater than 50%) so the Higher fibs come much more important.

Lets take traingle patterns.. Again the Higher fibs come into play as normally the two waves will relate to their proceeding waves by 61.8% or 78.6%.

In Elliott we do not use just Fibs isolation. Relationships between Alternate waves or wave lengths unfolding in the same direction are far more precise and reliable.
The Measured Move (1:1) would be a classic example of what Alternate wave ratio's are. We also combine these alternate wave ratio's with Fibonacci ratio's.

Again lets go back to our Wave 4 example .
We know Wave 4's like the lower fibs with 23.6% & 38.2% being the classic ratio's. We also Know that a Flat or Zig-Zag has the 3 wave A-B-C . The Alternate waves are A & C in this case.
When these two measurements combine we get the completed higher degree pattern. C will be a ratio of A into a classic lower fibbonacci ratio.

The two methods of measurement go hand in hand.

If people just start to measure fibs from any old swing point with out regard to the current market wave pattern, they are just gambling on which fib ratio might be the right one & 9\10 times they'll be wrong.

you said it well... truly combining fib with ew is powerful and accurate. sometimes i am surprised by its accuracy. i often times get the feeling of dejavu.
 
Fibs work because other people are looking at them. When you confirm them with indicators and key levels you have a much greater success rate with them. You should not just rely on fibs on their own. Its amazing how often fibs complete perfectly. You just need to develop an eye for drawing the correct fib. Using fibs during news announcements is also an incredibly powerful tool.
I use fibs on nearly every trade I do.
 
Top