Best Thread Debunking Fibonacci's Code...

Thanks to Barjon, here's my firts attempt to post a chart. This is a 60 minute chart of the FTSE 100 ($Z) in august shown with various retracement and extension levels on a swing basis. Please note that many of these are approximate - I make no representations that they're exact. However interesting that the market appeared to oscillate around these levels that have been discussed

cheers
P
 

Attachments

  • OT447300-05[1].PNG
    OT447300-05[1].PNG
    73.1 KB · Views: 593
[QUOTE=Paddington] fib is only one method alongside many others, and the proof or otherwise of its relevance is whether one can determine a set of trading rules based around it which generate a consistent profit of course! I expect to take some months to discover this.
Paddington in time you will see chart patterns happen over and over again

I certainly know people who use fib techniques successfully. The approach these guys take (you can read at tradingtutor.com) relies on pattern recognition around fibonacci ratios, specifically patterns called gartleys and butterflies and to a lesser extend variants of AB=CD. These patterns have more geometry in them than just the one fib ratio, and as an extension of that I'm looking to see where I can find multiple fib ratios at a point and seeing whether those points give higher probability trades. Will take some time to discover though.

patterns are ok im familiar with Larry Pesavento and Bryce Gilmore's work never studied under them but i know a lot of people who have. there patterns are good if they reflect your general thought of what way the markets is going but i have never traded their patterns because of their patterns if that makes sense

(3) allowing some wriggle room to allow the trade to work. For example if trading a 0.707 pattern are you able to set your stop so that it also works for a 0.786 pattern if that develops within your risk management plan? I.e. risk management and money management techniques as we know count for alot.

well thats very simple in short time frames the difference between 0.707 and 0.786 in the ftse say could be 4 or 5 points maybe less obviously the longer the time frame the more accurate you need it and on a weekly chart that could be a few hundred points


And absolutely I'm aware that there are lots more numbers as you say sqr(0.707) = 0.841 which comes up a bit as does 0.886 (sqr (0.786). I've yet to see these sufficiently often.

everymarket has its unique signature a bit like a personality and you will find that certain markets do one thing that other markets dont


Again if I learn how I'd be happy to post and follow up to see how these did. I understand that these patterns have an approx 70% probability but have yet to get enough history of my own to have a belief of my own around

70% is pushing it maybe Larry and Bryce can achieve that, you will find his students dont get quite the accuracy
you have to understand these 2 guys have been trading for a very long time and even though they trade their patterns they know which ones to trade and which ones to ignore that comes with experiece.
i would also like to add when i trade i look at many other things before i look at geometry
once im sure the market is going to go in a particular direction i use geometry to confirm that thought, if i dont find the geometry via time and price is not giving me any answers then im very cautious if on the other hand it confirms my belief then i set up a stratergy


Andy
 
Try to disprove fibs in order to prove them

Paddington said:
Thanks to Barjon, here's my firts attempt to post a chart. This is a 60 minute chart of the FTSE 100 ($Z) in august shown with various retracement and extension levels on a swing basis. Please note that many of these are approximate - I make no representations that they're exact. However interesting that the market appeared to oscillate around these levels that have been discussed

cheers
P
Paddington

Interesting - in my earlier post on this thread I wanted to show how taking the various fib levels and applying a 2% divergence either way could produce a whole series of numbers against which it may be easy to curve-fit. I also wanted to bring up the subject of how adjustment of the starting point might also make it easy to curve-fit.

What I did not state was whether or not I thought there was any credence in fib. In fact on other threads I have mentioned that I do think this to be the case, although I do not have the kind of scientific proof that the pdf article demands,

What I think would be an interesting exercise now, would be for you to take the same chart and attempt to draw realistic and reasonable trends, channels and s/r levels i.e. that indicate real buy/sell opportunities , where you deliberately try to AVOID fib levels.

If you can achieve this it would suggest that the former chart was just curve-fitting. If you cannot achieve this, genuinely trying, it would suggest that the fibs have some validity. To use them with a high degree of confidence suggests that there must be little or no ambiguity in their signals.

This really is the approach we should all be taking to testing strategies - we should aim to disprove them rather than prove them. If we cannot achieve the former it strengthens the case for the latter

Charlton
 
robq said:
http://www.lhup.edu/~dsimanek/pseudo/fibonacc.htm

Of course Fib retracements will work if most traders expect them to work!

This is, of course, the frequently cited reason why not just fibs but also many other TA methods 'work'.

One could more plausibly argue that if such an easily calculated measure that is readily available to all traders was being applied by 'most traders' then any advantage it provided would have long, long ago been traded out of the market.
 
blackcab said:
I haven't read this yet but did they do their analysis on the DJIA, or on something that is actually traded? Maybe I'm being stupid, but it might make a teeny bit of difference!

Hi blackcab,
just briefly to say that the DJIA is traded both via the futures contracts (YM) and via an ETF, DIA, much as the SP500 and nasdaq are also traded via futures and tracking stocks so it is a valid instrument I think
P
 
Paddington said:
Hi blackcab,
just briefly to say that the DJIA is traded both via the futures contracts (YM) and via an ETF, DIA, much as the SP500 and nasdaq are also traded via futures and tracking stocks so it is a valid instrument I think
P

No, Blackcab makes a very valid point. DJIA futures were only introduced in 1997, and ETFs are a relatively recent construct. The report's conclusions are based on analysis from 1914 forward. It would be interesting to see if there were any difference in the conclusions, if the analysis was run from the date futures were tradeable.
 
Blackcab
that is actually a very good point they did their analysis on the cash market which is perfectly ok though roll over contracts are better,but in the case of the Dow Jones to go back that far you need to use the cash markets.
their study is of one market, each market is different it has its own signature not just geometrically but structurely even if like some members cant except the geometry look at it this way:-
ES everyone trades it (meaning most will try it because its so liquid) its well known and documented that the amateurs trade the first part of the day and the pros trade the last part .
take US Bonds (ZB is much more liquid than US bonds) this is a more mature market less amateurs more pros trade it .(less erratic on a day to day bases) that alone creates a different signature to the market.
Crude predominantly institutions very large traders funds and so on many of them cant short so when they get out in large numbers it creates panic;naturaly all markets have their crazy day. forget the fundamentals behind it im referring to basically how it trades,
 
dcraig1 said:
This is, of course, the frequently cited reason why not just fibs but also many other TA methods 'work'.

One could more plausibly argue that if such an easily calculated measure that is readily available to all traders was being applied by 'most traders' then any advantage it provided would have long, long ago been traded out of the market.

Hi DCraig,
I think that there's a difference between certain numbers occuriing frequently and good trading opportunities around them. The value from a trading perspective has to be in applying a sensible trading and risk management strategy around these to ensure that you only enter into higher probability trades and control risk of course. Much like trend following or other systems that can work profitably for an experienced trader but lose money for a rookie I suspect that this is the same.

I follow the SP eminis alot at the moment and certainly see lots of 0.786s and 1.272s there, but cannot interpret them all as entries for a valid trade strategy. THe strongest ones I think maybe alongside regular support and resistance.

In the words of the guy I'm studying with at the moment "it's simple but it ain't easy".

I'm interested that Andycan sees different harmonincs in different markets, as that sounds totally plausible to me and I've heard from other sources, so one market may have alot of 0.618 and 1.618 vibrations for example while another has more 0.707/ 1.414 vibes. If you're looking for 0.618s on the 2nd market you won't find enough to be significant

As ever some people make money using these techniques and some people lose money so I suspect that the debate could continue for some time ;-)
P
 
Paddington said:
Hi DCraig,
I think that there's a difference between certain numbers occurring frequently and good trading opportunities around them. The value from a trading perspective has to be in applying a sensible trading and risk management strategy around these to ensure that you only enter into higher probability trades and control risk of course. Much like trend following or other systems that can work profitably for an experienced trader but lose money for a rookie I suspect that this is the same.

I follow the SP eminis alot at the moment and certainly see lots of 0.786s and 1.272s there, but cannot interpret them all as entries for a valid trade strategy. THe strongest ones I think maybe alongside regular support and resistance.

In the words of the guy I'm studying with at the moment "it's simple but it ain't easy".

I'm interested that Andycan sees different harmonincs in different markets, as that sounds totally plausible to me and I've heard from other sources, so one market may have alot of 0.618 and 1.618 vibrations for example while another has more 0.707/ 1.414 vibes. If you're looking for 0.618s on the 2nd market you won't find enough to be significant

As ever some people make money using these techniques and some people lose money so I suspect that the debate could continue for some time ;-)
P

Hi Paddington,

To be straight, I'll say up front that I think fibs are a probably a load of bunk in trading. However, one thing I have promised myself is that I will not through laziness overlook anything that contribute to being successful at trading IF I can see to my satisfaction that there is good reason to delve into it. I remain to be convinced of the latter for fibs.

Just because a successful trader says they use fibs proves nothing - experience counts for a lot and the placebo effect sometimes works wonders. In your post you say that you believe that fibs work best at S/R levels. Well that could be an argument for correct S/R levels rather than fibs.

The whole problem with fibs is that I have never seem a plausible explanation of what underlying market principle or mechanism they claim to describe - remember mathematics can describe and model the real world, it does not control it. This is the core of the problem.

It seems the arguments for the usefulness of fibs are

1. Many traders use them so they become a self fulfilling prophecy. Maybe, but the argument cuts both ways as I pointed out above. In any case most traders lose.

2. Numerology - attributing magical properties to numbers. I have no sympathy with this whatsoever. There is nothing sacred about any number, ratio etc. There are exceedingly important numbers in mathematics and physics pi, e, Planks constant etc etc etc but they are used in theories and models of the real world - they don't control it. On the other hand fibs are just imposed on the market in an act of faith unsupported by any model of market behaviour or any real experimental evidence. Academic studies turn up zilch though I agree that is far from conclusive.

3. Along with Elliot wave, they supposedly represent human psychology. A pretty strong claim. I am instantly skeptical of anything that appeals to human psychology or human nature as justification - because that latter is so open to an enormously broad interpretation. It sounds like a sales pitch. It also sounds like the advocate is claiming a special handle on human psychology lacking in the rest of us. As for what another poster said about geometry describing (or governing) human emotions, I suggest that question be put to mathematicians or psychologists or the 'man in the street'. I have little doubt of what the answer would be.

I'll concede that this very negative post but it is a few of my thoughts on the matter.
 
so one market may have alot of 0.618 and 1.618 vibrations for example while another has more 0.707/ 1.414 vibes. If you're looking for 0.618s on the 2nd market you won't find enough to be significant

Spot on!!
but let me also point out Analysing a market and Trading a market are two totally different disciplines
you can be the best analyst ever and be a totally crap trader. why? because of emotions plain and simple. when you have money on the line it generates an emotion starting traders fight to keep it under control seasoned traders control it better. back to the geometry
a trending market will show extension and correction which are different to corrective markets in es for example you will find fib ratios more prominent.
but how does one know if its going to be 0.382 ,0.618 retracement or 0.786 or any other variations?? well first lets assume we have a trending market with a bullish bias the market moves up, the nature of the move in most cases (V lows or blow off lows are different)is one of caution so the first retracement is deep but how do you know? well support CAN play a part but not always
market structure is the key also different time frames can give you small clues what it wants to do. take an abc move down the up move is fast the correction is a 1:1(a=c) this means that the down move is taking much longer than the up move there is an overbalance in time that can be a clue but as i mentioned before,every market is different if that abc 1:1 happened and retraced to the 0.5 rt 9 out of 10 times its going lower.
if a market moves up fast the 1st correction is deep so look for the 0.786 or there abouts(here timing comes into it) the second correction will not be as deep but if it is deep then assume the up trend is corrective
basically i could go on and on do we know for sure with 100% certainty where the correction will stop at?? of course not thats why trading is so subjective can we accurately predict a retracement? from my perspective when everything comes together i have been known to nail the lows and highs
 
Along with Elliot wave, they supposedly represent human psychology. A pretty strong claim. I am instantly skeptical of anything that appeals to human psychology or human nature as justification

Trading is is 90% psychological 10% technical
what part of psychology in trading dont you get?

dcraig1 your a sceptical one aren't you?
this is good but dont get wrapped up in disproving something until you have given it at least a shot
when i first started i looked at every indicator oscillator you can imagine it just never worked for me macd rsi stochastics MA hidden divergences i just could not get with it i saw it but too subjective for me, but i did have a go and though i see and know people who use it their brain is wired that way not mine
i can say its crap but i also know many will disagree, but its what floats your boat.
and by the way i have never studied elliott wave im aware of roughly what it is but i use my own ideas of wave structure
 
andycan said:
Trading is is 90% psychological 10% technical
what part of psychology in trading dont you get?

Really ? Then why is more than half the volume on the NYSE program trades. And why are doctorates in physics and mathematics in much more demand that doctorates in the social sciences in the professional trading world of big hedge funds ?

I'm not denying that getting one's emotions under control is essential and also that it is not any easy thing to do sometimes. But it's not the end of the story by any means. I once read that the most important thing about becoming a good trader is having good powers of observation and I can't disagree with that at all. For example for the last few months I have been looking at order book behavior in stock index futures - not by staring at the DOM which I always found incomprehensible - but by computer analysis. As it seems there is precious little of any worth written about this topic, it has been a matter of observation and programming. It has been an eye opener for me, and told me more about how to trade SIFs than any amount of pop psychology ever could.
 
Then why is more than half the volume on the NYSE program trades

yes have you seen the dow drop when there is a PANIC
note the word panic not 'casually covering positions'
i think you need to explore this a little closer
the person who comes to trade a market has one objective:- MAKE MONEY
(greed)
if he doesn't and start to loose his capital will panic (fear)
basic human elements of a trader that is unquestionably a fact greater traders than you and I have said this and written books on the subject.
as for institutions and program trading
now their thoughts are a little different because they dont trade their own money but take a look closer at the charts on option expiration look carefully where calls and puts are heavily invested and see how 9-10 times the option expires out of the money ,take a look at the quarter end when program traders institutions dress up the chart so they get their bonuses (GREED)
sure the program trades are executed without emotions they also move markets but how does that benefit you or me they have an unlimited amount of money if they loose a few million percentage wise its insignificant
tell me if you lost 1m you would be ok.
i take my hat off to you if you would be smiling after that

And why are doctorates in physics and mathematics in much more demand that doctorates in the social sciences in the professional trading world of big hedge funds ?

its also a fact that most wall street traders are fundamentalist not technical traders does this make TA nonsense?
they employ people with mathematics and physics background because they believe they have the right aptitude they are logical and calculating and precise
what they dont tell you how many of them flunk out because they cant handle the pressure (oops another emotion), a great friend of mine was a pit trader in chicago and now trades his own money makes millions a year i rank him among the best there is. is he a physicist or a mathematician nopes he is a farmer
 
There’s a difference of course between analysis and trading; technical analysis, trading system.
Unless a trader is using a mechanical trading system, ie computer generated B/S signals they’re discretionary trading and using some form of analysis — technical, fundamental, both, to form and execute B/S opinions. There’s an infinite quantity and variety of analysis data with which to make B/S trading opinions and ‘fibonacci price levels’ are just one, albeit a very simple and easy method to use.
Any method is proven to work based on the fact that the individual wouldn’t continue to use it if it didn’t, including ‘psychic’ methods, the color of the knickers one’s partner’s wearing today, whether or not 3 crows flew overhead this morning.

Applying the fibonacci ratio to Price works because it’s just that, a ratio, an elastic ratio that having measured point A to point B merely indicates other fibonacci levels based on that measure. Naturally many times the price will, co-incidentally (or otherwise) interact with the levels, surprised ? don’t see why, one’s only dealing with A to B points, nothing’s changed because the ratio’s being used on Price.

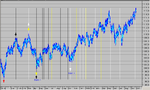
The first DJIA Daily attached is fibo Time lines, L-H etc then project from a L/LC etc, ie W2, using indicator lines at 0.382, 0.5, 0.618, 1, 1.618, 2, 2.618. (MetaStock indicator)
As stated earlier I don’t find fibo Time projections to be useful.

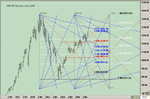
What intrigues me more than fibo levels is the Gann Box tool in Advanced GET, where Price appears to follow the ‘blueprint’ of a pre-drawn Gann Box, see attached S&P.

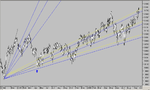
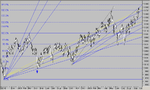
One can work with the Fibonacci Fan using H, L, C etc, adjustable as the price progresses,
and combine fibo levels and fans, see DJIA Daily charts attached. (MetaStock)

“The proposition is that when the market changes direction after a period of trending prices, the magnitude and duration of the next trend is not random, but depends on [appears to be related to] the magnitude and duration of the previous trend.”
The proposition is correct.

Fibos are useable because Waves/trends are discrete; the more accurately the ‘discretes’ are identified, then measured, the more accurate the fibo/Price level interactions appear to be, bearing in mind that Price and Time are 2 separate and irregular — random — components of the PriceTime Movement.

How one trades fibonacci analysis is another matter, the attached pdf may help.

.
 

Attachments

  • fibo time.png
    fibo time.png
    19.5 KB · Views: 581
  • 500.png
    500.png
    26.8 KB · Views: 599
  • dj fans.png
    dj fans.png
    24.8 KB · Views: 361
  • dj fan fibo.png
    dj fan fibo.png
    31.2 KB · Views: 487
  • A Primer in Fibonacci-Trading.pdf
    214 KB · Views: 2,737
Nice post Trdr
the conventional 'fib trader' may well use these tools i have never used them so i could not comment on how good they are.
the thesis by the 2 PhD's concluded that applying Fibonacci ratios was basically a hit and miss situation and to a degree i agree
to apply a static solution to a dynamic environment is a bit like every time you go to the doctors your course of treatment is antibiotics, statistically there will be a percentage that the course of treatment is correct but there will be a percentage which are incorrect and applying fib ratios statically will give a similar result.
point being that a market where there is a congregation of buyers and sellers
over time will generate chart patterns, these patterns will be different for every instrument tradeable if every market was identical then every extension every correction would be measurable with extreme accuracy
so applying your standard 0.382, 0.618, 0.786 (fib ratios) etc will produce a mixed result
to understand a market from a chart reading perspective one has to be familiar with how a chart moves over a period of time. its a fact that markets move in series of waves they certainly dont move straight up or straight down i believe we all know this, the problem is that elliott wave serves no purpose to most simply because its considered 'unpredictable' many trader have said it and written books on the matter. for some reason we humans assume that because it is written we expect it to be true and very few go out of their way to prove or disprove a so called fact or opinion.
i have always been a sceptic but i also except that there are 'facts' i cannot prove or disprove and there are 'facts' that i can prove or disprove
i have proved to myself that geometry has predictability in the markets (fib derives from 2 squares within a circle, the end of the square or rectangle to the arc or the circle is fib thats the relationship of the square and fib)
i have proven to myself that wave structure is predictable the combination of geometry with wave structure gives me the unique signature of each market i trade. it is nonsense that if you have a move up and then a retrace and project the next move up to 1.618 that you will be right all time.
the funny thing is that most of the answers we search are right in front of us
the problem is we dont see because we have not trained ourselves to see or we assume a fact and take it for granted,that said dont assume what i say is fact search the truth for yourselves
TrDr price and time are seperate but there is a relationship between price and time if it is not by direct measurement its usually by vibration or the vector of the move, if its a major low or high there will be relationships with previous swing highs and lows of the past. in time and price
food for thought
 
Andycan, so we can see what you're talking about, please post a couple of charts to illustrate:
" i have proved to myself that geometry has predictability in the markets (fib derives from 2 squares within a circle, the end of the square or rectangle to the arc or the circle is fib thats the relationship of the square and fib)"
and
"... a relationship between price and time if it is not by direct measurement its usually by vibration or the vector of the move, if its a major low or high there will be relationships with previous swing highs and lows of the past. in time and price"
 
Trdr
sure no worries i will do it tomorrow i have some analysis from when i was looking for the low in bonds i use a program called cycle trader and you cant copy or save the charts if you are running it of windows xp so i will manually sort it out and try and explain what my thinking was at the time
 
Top