Best Thread Debunking Fibonacci's Code...

all charts are of 30yr US Bonds (note slightly out of date)
image one shows time is almost 1:1 from the swing high to the swing low actually 3 calendar days shy
Image two once i had my low i looked back at analysis i had done many moons ago and found this 0.7236 = 1/1.382
Image three looked at the standard retracement which was 0.8517 or 0.852 = cube root of 0.618
not ideal
Image four an abc1:1.07 some would consider it a 1:1 (a=c) Gartley fans would have had a try but would have initially suffered
anyway the 1:1.07 = the hypotenuse of 1 x 0.382 now we are getting some correlations
Image five another reference to 0.7236
looking much better
Image seven an inversion targeting the low at this point i was convinced we had a low
Image six a simple projection of a short term high which we have just had i did this a few days ago note the 0.7236 shows it self again.
to correlate 0.7236 to 1.618 we just need to do a simple calculation which is
0.7236 =1/1.382
1.382 = 2.236/1.618 note 2.236 is square root of 5 for geometers root 5 binds root 2 and root 3 to fib
this is a very simple analysis to give you an idea of what i refer to as geometry the complexity is when the geometry is hidden at that point im very cautious
 

Attachments

  • Image1.gif
    Image1.gif
    85.1 KB · Views: 544
  • Image2.gif
    Image2.gif
    93.8 KB · Views: 502
  • Image3.gif
    Image3.gif
    99.1 KB · Views: 417
  • Image4.gif
    Image4.gif
    89 KB · Views: 466
  • Image5.gif
    Image5.gif
    84.6 KB · Views: 380
  • image7.gif
    image7.gif
    90.2 KB · Views: 685
  • Image6.gif
    Image6.gif
    97.1 KB · Views: 536
(fib derives from 2 squares within a circle, the end of the square or rectangle to the arc or the circle is fib thats the relationship of the square and fib)

Trdr this reference is how one derives from the circle to the square to fib
many assume phi because its there and written in books i have just pointed out that there is a geometrical and mathematical relationship between them
 
Last edited:
Thanks for the charts Andycan.

I'd use the Gann Fan more if I could enter user inputs in the one provided by MetaStock.
The fans remain relatively stable with re-scaling but individual Gann Angle lines don't.
Mind you, draw enough lines . . .
 

Attachments

  • dj gann.png
    dj gann.png
    37.2 KB · Views: 637
Thanks Trdr
i use to use metastock but i found it limited i dont program so tradestation and metastock are no good to me
cycle trader is a great program but hard to use as its programing is dos based
for quick analysis i use gannanalyst pro 5 it has gann fans which you can input your ratios as you see fit i would not have a clue what to do with them but i know its there
 
just a quickie
image 6 i showed a projection using basic geometry at target price
note we have had the second deepest correction my minimum target is 111 (for a quick short pretty close overnight as it stands)dec basis structurely we can go to 109 area and deeper (for a longer term short)
just to point out that PHD's cant prove geometry works, therefore we as lesser mortals accept mmmh maybe there is a lesson here
 
Just seen this thread after checking out andycan's other posts....:oops: ;)

Anyway this chart of the OEX gives a good indication on a market working the square... I took a snap shot at the time ...and we know what happend from that natural price pressure point...

altoex.png
 
Last edited:
nice one Bez
isn't it sweet when it all comes together?
remember the sp cash i was targeting 1450 area and end of novemeber i'll post the charts so you can see will take a few minutes
 
sp projection cash basis
will show a few there is a lot more to support the timing and price but i think a taster should be adequate and everyone should do their own work
and of course i could be dead wrong
 

Attachments

  • Image1.gif
    Image1.gif
    89.9 KB · Views: 424
  • Image3.gif
    Image3.gif
    84.4 KB · Views: 438
  • Image4.gif
    Image4.gif
    84.7 KB · Views: 436
  • Image5.gif
    Image5.gif
    89.3 KB · Views: 401
  • Image6.gif
    Image6.gif
    92.1 KB · Views: 454
Those are some serious charts there andycan 8)

Its not often you see people using should detailed time and price stuff like dynamic vibration ect...

The 1450 is deffo something to watch..

Thanks for those charts

Bez
 
Bez said:
Those are some serious charts there andycan 8)

Its not often you see people using should detailed time and price stuff like dynamic vibration ect...

The 1450 is deffo something to watch..

Thanks for those charts

Bez
Bez
just one of a few road maps i make, gives me a sense of direction,
but one has to be cautious, because geometry is more a factor of where we stand in perception to the particular market rather than the market changing. simply, lets take your excellent example of oex weekly so those who are not familiar understand. your example shows 1:1 corrective moves down with a retracement of 0.5 and 0.707, to the novice oex is following the square but thats one of its many faces, the 1:1 corrective moves are 0.786 of the previous corrective move down so now we have a reference to fib and for this simple complexity, that is one of the main reasons most struggle with the concept. price and time is a bit like saying, which side of the marble is up.
the trick is that once a market tips its 'hat' and lets you know what 'form' of geometry it is using then one can predict the market more accurately, but with all that said and done there is still the 'human error factor'.
The S&P forecast im showing is one side of the ratio factor which is common in S&P
time and price are interchangeable so price can be following the trine and time the square or visa versa.
the reason i showed the vibrations and vector is simply because S&P is rather fond of showing that side of geometry but that would very rarely work with US Bonds!
 
Bez said:
Thanks for that...


I myself am not a pure hard core waver....I use geometry of the marksts as you can proably tell from my posts, its just EW is the most powerful tool help detemine structure and rhythm that I've found.


Even geo people like Gilmore, points out his system of narrowing down 4 waves into ratio's of sacred geomerty still conforms with the rules laid out by elliott but removes the subjective count problems.


I enjoy your charts and when I've re-booted my ensign I start puttting a few more of mine up...
I hope you dont mind me putting your last post here i think it unfair to hijack Mr Black's thread

EW or wave structure is very powerful indeed but it has to be view from various time frames take the dow or es so many people in a panic dow new highs! es not! what going on its too high!. the move up we currently have in dow is a C leg up plain and simple
that C leg will have untold waves on the weekly/monthly we have to always look at the bigger picture i include the long term dow
then one narrows it into the weekly and then the daily this current move up could be viewed as 5 waves i dont,i see it as a w3 on the weekly or monthly or an extended C leg
the correction we should soon experience is going to be a w4 the question is how deep is it going to go and how fast we shall see soon enough
 

Attachments

  • Image1.gif
    Image1.gif
    77.6 KB · Views: 370
  • Image1.gif
    Image1.gif
    72.3 KB · Views: 405
Last edited:
Great Post ,Looking at someones interpretation of the 1988 fall , Elliot waves(application of Fibbonaci) can't help thinking that maybe the application would be more appropriate to a study of EL Nino.
 
Andy,

I read the first post, and the last few (I don’t think I missed anything in between). On a basic level, my objection to the validity of Fibonacci is that while it reflects many mathematical aspects of the natural world, when applied to a non-natural, man-made, abstract (ie intangible) construct like the markets, unless it was based originally on those principles then I can’t see how those principles will be manifested unless by accident. (Do I get a prize for the longest sentence on T2W?)

If they are present then one can assume they are so by virtue of the major players using them as a basis for trading – possible, but stretching credibility.

Interesting point re your “common denominator” and reaching the sub-harmonic. I don’t think it unreasonable to assume a common denominator exists at a low level (for just about everything) but the question is whether it has any value or application if found. For example (struggling to find something appropriate), measuring the distance between two points using a metre ruler – it will be as accurate as the method used. Greater accuracy will be achieved by using finer measurements – centimetre, millimetre, etc. If a measure was originally found to be 1 metre in length but subsequently found to be 1.001 metre, the difference is insignificant. Couldn’t this be the case with your example in relation to the market?

“geometry is a mathematical representation of the human psyche”. How so? I’m not familiar with this. Is it based on the pythagorean notion of reality?

Regardless of any disagreement – possibly due to my low level understanding of maths - an interesting discussion.

Grant.
 
grantx said:
Andy,

I read the first post, and the last few (I don’t think I missed anything in between). On a basic level, my objection to the validity of Fibonacci is that while it reflects many mathematical aspects of the natural world, when applied to a non-natural, man-made, abstract (ie intangible) construct like the markets, unless it was based originally on those principles then I can’t see how those principles will be manifested unless by accident. (Do I get a prize for the longest sentence on T2W?)

If they are present then one can assume they are so by virtue of the major players using them as a basis for trading – possible, but stretching credibility.

Interesting point re your “common denominator” and reaching the sub-harmonic. I don’t think it unreasonable to assume a common denominator exists at a low level (for just about everything) but the question is whether it has any value or application if found. For example (struggling to find something appropriate), measuring the distance between two points using a metre ruler – it will be as accurate as the method used. Greater accuracy will be achieved by using finer measurements – centimetre, millimetre, etc. If a measure was originally found to be 1 metre in length but subsequently found to be 1.001 metre, the difference is insignificant. Couldn’t this be the case with your example in relation to the market?

“geometry is a mathematical representation of the human psyche”. How so? I’m not familiar with this. Is it based on the pythagorean notion of reality?

Regardless of any disagreement – possibly due to my low level understanding of maths - an interesting discussion.

Grant.
Grant

Good questions deserve good answers.
let me see if i can explain.
Fibonacci as many recognize it, is applied because as you rightly say its appears to be all around us, it appears to be a natural order of things
and the assumption that if its all around us then rightly it should be present in 'so could random events.' (if that is what one believes)
this was what these so called phD's were trying to do, to prove if fib worked and the answer is yes and no, to why it works is dependent on the type of market and most importantly how its applied.
now why the majority use it i can only hazard to guess that they read it somewhere and accept it or they themselves see it works in their chosen markets and sometimes it works perfectly and other time it does not but it serves to be used as a reference point.
i believe the latter is probably more realistic of those traders that do well, but nonetheless how the fib ratio is derived is how one perceives it.
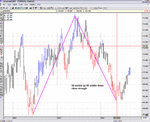
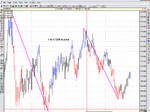
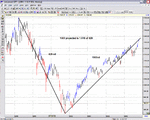
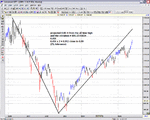
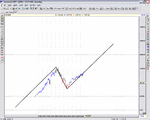
lets take a simple situation a market makes a wave 1 which i will refer to as W1.
W1 goes up then it retraces and makes a W2, many will expand W1 by 1.618 to give a target price, thats a reference point, say for argument sakes it hit 1.618 and retraces to make W4 then many or some, i have know idea will then look at how long W2 took to form, apply a fib time and clone it to W4 to see if there is a relationship to 0.618 or a derivative and if there is i suspect they will consider it a squaring of price and time and Bob is your uncle!!.
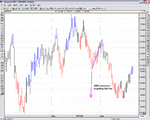
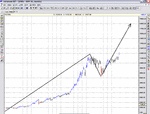
that particular exercise is one perspective, one needs to know if this move is a dominant move or not, is this potential 5 waves part of a much larger W1 or W3, is it corrective or directional. The 5 waves up could have perfect phi relationships but as i mentioned if its part of a much larger structure then that structure could be using the square rations such as 1.414, 2.414 0.707 etc so then which one is right?
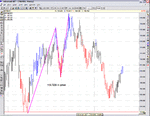
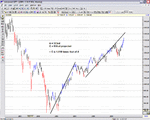
and that structure could be part of an even larger structure which relates to the cube 1.732, 3.464, 0.577 etc and so on, which to a degree answers your measuring question the answer is opposite to the accuracy issue the longer time frame has precedence over the shorter time frame because in real worlds situation what happens in 1 min can be viewed as noise but what happens in 1 year is measurable and comparable to the masses and geometry wants to take into consideration everyone playing not just the few.

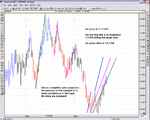
now going back the ratios, there are market that expand by the square relationship but retrace to the fib relationship
equally not all markets work on the classical sense of 5 waves so thats another spanner in the works again different markets have different structures hence different geometric relationships.
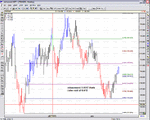
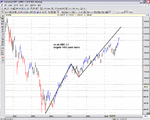
But what they all do is rotate from one relationship to another sometimes it is crystal clear other times it is not, that to me is the essence of geometry. how is that for the longest answer?

in fairness do the major players use geometry?
they could do, though i suspect their participation is unintentional in their eyes but one that creates the end result
this leads me to your question of the human psyche.
markets involvement will create emotions does not matter whether its program trading or huge institutions, the initial action is always human involvement and the end result is too. therefore money is made by hook or by crook taken from the weak by the strong and this is measurable.
or certainly they way i see it.
and as for disagreements i see nothing but good old fashion discussion

regards
 
Andy,

Thanks for the detailed reply.

I think you’ve highlighted the crux of TA – sometimes it works, sometimes it doesn’t. It is for this reason I have a deep suspicion of it. It lacks any coherent basis because of its random/ad hoc nature but at the same time I recognise its value – a frame of reference in a seemingly chaotic and largely unpredictable environment (a view in itself contentious).

On a basic level we have difficulty when confronted with a lack of stability and structure in all aspects of life – on a personal level I have great difficulties with this. Maybe this is how we developed intellectual capacity (but why humans should but not other animals is beyond me). We feel more secure in an ordered, familiar environment and if it’s absent, we try to impose (any) order.

The markets have got be a prime example of how we function – countering fear, uncertainty, insecurity, irrationalism, hyperbole (joke) via any means that seem to work. When the indicators fail, we re-invent and adapt. And on it goes - the search for the Holy Grail.

Grant.
 
grantx said:
Andy,

Thanks for the detailed reply.

I think you’ve highlighted the crux of TA – sometimes it works, sometimes it doesn’t. It is for this reason I have a deep suspicion of it. It lacks any coherent basis because of its random/ad hoc nature but at the same time I recognise its value – a frame of reference in a seemingly chaotic and largely unpredictable environment (a view in itself contentious).

On a basic level we have difficulty when confronted with a lack of stability and structure in all aspects of life – on a personal level I have great difficulties with this. Maybe this is how we developed intellectual capacity (but why humans should but not other animals is beyond me). We feel more secure in an ordered, familiar environment and if it’s absent, we try to impose (any) order.

The markets have got be a prime example of how we function – countering fear, uncertainty, insecurity, irrationalism, hyperbole (joke) via any means that seem to work. When the indicators fail, we re-invent and adapt. And on it goes - the search for the Holy Grail.

Grant.
Grant
if this is an avenue you would like to explore may i suggest you start with the basics, initially it requires you to train yourself
to see differently
look for now at 5 waves moves, relate the up moves to upmoves and downmoves to downmoves, see if you see a pattern!!
also look at ABC structures or 123 relate A to C and B to A and C, for now,try it for a while i suspect you may get feeling for it
then you may well start seeing other relationships
one step at a time
good luck
 
Andy,

Thank you for tip. I may be a cynic but I am open-minded. Can you recommend where I might get the basic info to start? I've got basic fib functions on my charts but no detail as to what I should be following (or adjusting parameters).

Thanks again.

Grant.
 
grantx said:
Andy,

Thank you for tip. I may be a cynic but I am open-minded. Can you recommend where I might get the basic info to start? I've got basic fib functions on my charts but no detail as to what I should be following (or adjusting parameters).

Thanks again.

Grant.
Grant

PM on its way
 
El Nino Change

Since my last post on this Thread , I did some rejigging of the Momentum and Fibbonaci on my
program and ran through some data. On the 13/02/07 I noticed what looked like three waves
on the Nikkie. the Momentum went through zero 3 days prior , and a Candle 'Spring" was apparent on the change over. Additionally to this there was a EMA cross over.
The revelance to Fibbonaci is prehaps in the waves. Based on prior lows I based a prediction
around 30% -> 50% rise of the Fibbonaci adjusted to last trading day.
Also EL NINO has know officially switched.
Maybe just luck
 
I have just re-read my post and (can't spell the word) with the spelling.
I paste data into Text files for my program to read. The last time I did this was on the 13/02/07.
My Momentum/ROC indicators are pre -Derivative , the sample size is Best Candle, my EMA are 30 day non typical. FibonaccI as applied to the 1988 retracement gave me the idea to apply the same to Elliot Waves(Or waves as I see them) Obviously this implies a future Time period to be decided(assuming the expected Open Close prediction are undecided)Fibonacci calculations in this grey area of pre-deriviation, I think , makes a case for Fibonacci as a tool to be applied to non atypical situations atypically.
 
Top