Who said bias doesn't exist?

JonnyT

Senior member
Messages
2,560
Likes
22
Hi all,

I've been plotting PnF charts 3x3 for FTSE futures and Deal4Free cash price this morning.

A 21 point rise in the futures has had a corresponding 36 point rise in the Deal4Free cash price.

The cash is trading 45 points above the futures.

If this isn't bias then I don't know what is.

JonnyT
 
Later today I will post both PnF charts.

It should be remembered that most futures charts are derived from the last traded price, my Deal4Free ones are from the bid price.

That means effectively the Deal4Free price has moved even more...

On this move it peaked minutes before the futures did, and then didn't follow the futures.

It would seem that the cash prices do not correlate with the futures, but are probably manipulated for the benefit of the bookmaker...

JonnyT
 
Hi JonnyT,

Will be interesting to see your charts as I've just had a quick look and the D4F cash price moves have pretty much tracked the futures to within a point or two (in terms of moves) all morning as far as I can make out.

On this move it peaked minutes before the futures did, and then didn't follow the futures.

Are you absolutely sure that you are not looking at a delayed futures feed? :)
 
Hi Richard,

My FTSE feed is supposed to be live...

I'll be castrating someone if it isn't. Haven't set up IB for dealing FTSE futs yet so don't have the verification.

The chart comparision will be interesting though.

JonnyT
 
Hi Richard,

So far the PnF charts are well different.

The Deal4Free chart doesn't have a trippled bottom, nor does it have a double top breakout.

My Daytrading system for FTSE is currently up 40 points, initial target is 50. Based on TSR using 3x3 PnF

JonnyT
 
Hi JonnyT,

The Deal4Free chart doesn't have a trippled bottom, nor does it have a double top breakout.

Strange - I did my own to check & I have both those features. The difference could simply be down to the base figure for the boxes. My boxes are based around 3600 (i.e. boxes at 3597, 3600, 3603, etc) and I was also using the mid-D4F price, so this would equate to boxes at 3595, 3598, 3601 with the bid price.

Using different box levels can result in quite different looking P&F charts (*). Indeed, when comparing different P&F charts it is probably sensible to ignore one box differences or where there is an extra column of minimum height. Actually, for direct comparison it is probably most sensible to use standard bar charts.

* - this is actually a bit of a philosophical issue which I have thought about for some time. If a P&F chart based on 3600, 3603, etc gives good signals but one based on 3601, 3604 doesn't then does that mean that the good chart is merely a statistical fluke? I have a medium term system for the Dow using a 50x2 P&F chart. It produces quite stunning results using boxes at 8000, 8050, etc. I have also checked it using boxes based on 10 & 60, 20 & 70, 30 & 80 and 40 & 90. With all of these the results are mediocre. This hasn't stopped me trading this system, but I do worry that the good results may revert to a mediocre mean.
 
Hi Richard,

With PnF I aways use a divisable level. i.e 3600 for a 3x3.

Sierra seems to do the same.

PS you are comparing the D4F cash price and not the D4F future price arn't you?

JonnyT
 
It would be great if there was a bias between the sb firms and the futures, just think how much risk free cash we could make using arbitrage!!
 
Hi sidinuk,

<quote>It would be great if there was a bias between the sb firms and the futures, just think how much risk free cash we could make using arbitrage!!</quote>

But there is!

Deal4Free's cash price is quite a bit above the futures price. Sometimes its the other way.

JonnyT
 
Hi JonnyT,

With PnF I aways use a divisable level. i.e 3600 for a 3x3.

Yep, that's the standard. But when it comes to comparing two different charts such as the futures & D4F cash there is a problem. With absolutely no additional bias at all, but a fair value difference that is not divisible by the box size you will automatically get different looking charts. e.g assume that the futures are currently in an O column which bottoms at 3600. They then move to 3609 before returning to 3600. This will give a 3 box X column followed by a return to O. If there was a fair value difference of 31 points, the corresponding cash move would be from 3631 to 3640 and back to 3631. The up movement would not be enough to show however as it would have to get to 3642 to give the necessary 3 X boxes (since the last box in the O column would be at 3633). The moves have been identical in size but the P&F charts are different. It only takes a few such examples during the day for the charts to appear completely at odds with each other. Hence why the starting point for the boxes matters if you are going to compare two related instruments.
 
Charts folks

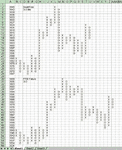
Here are todays PnF charts as promised.

Great day for my technique, plus 80 points.
 

Attachments

  • ftse.gif
    ftse.gif
    50.2 KB · Views: 728
Hi JonnyT,

Sorry mate, but I can't see how those charts back up your claims, specifically where you said "A 21 point rise in the futures has had a corresponding 36 point rise in the Deal4Free cash price. "

The only possible incidence of bias I can see from your charts is the missing of the counter move in column I of the futures chart - but I can see that move when I look at the chart in D4F! (a brief spike down at 08:23).

Apart from that, I can't see anything in the charts you have posted that could not easily be explained by the fair value difference not being divisible by the box size plus the occasional point difference (which could simply be due to D4F using the current futures spread rather than last trade price).

To illustrate what I mean about the fair value difference, here are the same charts but using the D4F mid-price:

bias.gif


I see there is a slight difference in our Futures charts - I don't have the 3 box reversal that is columns Q and R in yours. Probably due to Sierra polling MyTrack at slightly different times. Again, though, this just shows how different P&F charts can appear whilst essentially being the same data.
 
Hi Richard,

My Futures feed was delayed. This months fees have been waived :)

JonnyT
 
Hi mmillar,

If you cared to read my ealier posts you would note:

1) I haven't got my trading platform set up for Liffe futures yet.
2) I'm papertrading a PnF system based on 3x3 TSR for FTSE, with an initial target of 50 points.
3) I Haven't divulged the system as it is not 100% mechanical. The basic principle is to:

a) Trade bounces off support
b) Fade bounces off resistance
c) Go with the trend (i.e look for 50 points a trade)

Such a system may be tradeable with SBs as well as futures, hence my tests today.

JonnyT
 
Hi,
I am trading liffe ftse futures and have been looking for
a real time p & f chart, could you let me know where to
find one ?

thanks ian
 
Hi Ian,

Try www.sierrachart.com $40 for 6 months plus datafeed costs.

If you have an IB account this can be zero (just £20pcm Liffe fee) or via MyTrack around £50pcm

JonnyT
 
Entyr and Exits

Hi JonnyT,

You said yesterday that you made 80 points using your system, are you willing to say where you entered and exited your trades ?

Thanks


Paul
 
Top