madasafish
Well-known member
- Messages
- 470
- Likes
- 5
THE INFALLIBLE INDICATOR FOR TRADING FUTURES
It sounds a big claim: an infallible or “never wrong” indicator . But I can assure you all that it exists and seems to work for any index I have tried (Dax, S&P,Nasdaq, FTSE, Ibex). Basically the idea is simple. The futures drive the cash index so if you study the relationship between futures and cash you can tell which way the futures are moving.
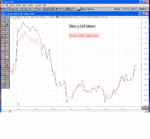
If the futures are higher than cash, then the move is up and if lower then the move is down. It seems trite, dead simple and rather obvious. Only the reality of life is that there is continuous arbitrage between cash and futures so if futures (say) rise too much above cash, people sell the futures and buy cash and vice versa. . So if practice futures oscillates ahead of cash and then below it. The chart below showing the 5 minute S&P futures in black versus cash for Monday 17th March 2002 is a case in point.
Now a fluctuating line above and below the cash index is of little use but if we measure on a moving average basis the difference between the cash and futures currently are from the moving average of cash and futures we can establish a trend.
The formula is absurdly simple:
For the S&P futures:
CL+CL(SPX.X)-MA(CL+CL(SPX.X))>0 for futures up and <0 for futures down.
Where: CL is the closing price of the last bar of the futures
SPX.X is the S&P 500 cash index
And MA is a 3 bar simple moving average (5 works but is less sensitive)
For FTSE replace SPX.X with FTSE index, etc
When the formula is >0 it’s a buy and when <0 it’s a sell.
It works in any timeframe .. and for any index (although it has to be written for each index.)
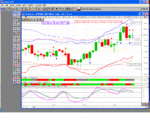
I have set it up in my charts as a colour marker which is green for up and red for down and it is shown in the following chart as the colour marker called “SPOOSDIFFc” in the lower section of the chart.
Now on its own it can give false entries as it is based on a moving average and hence this can change in value before a bar completes in time so I would not use it on its own to buy or sell. But as a confirming indicator it is faultless. It prevents so many trades where the indicators or patterns suggest one thing..but…
(This indicator is based upon ideas from http://enthios.com/trading/nq-compx1.htm but I have taken them an modified them.)


