Where is the Dow & others heading in 2005?

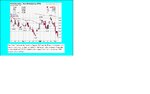
Another short added this one bigger then the previous stakes. Quite a hefty position accumalated now.

If anyone is still sitting on the sidelines then you may consider entering a short, especially long term traders as entering a position at these levels could be regarded as a low risk trade.
 
Has it got a nice beach ?
Salty – you get a smart orange suit and sea views…..

And it’s nice for dog lovers providing you don’t smell of semtex …..

posted by user..
If anyone is still sitting on the sidelines then you may consider entering a short
But what if it carries on going up……?........... :confused:
 
But what if it carries on going up……?...........

If I was sitting neutral at the moment, then I rather go short then long as my analysis corroborates with that direction.

With a stoploss not too far away this could be a low risk trade from a long term trader prospective. If it works out to the downside then the return should be far greater then the risk as the chart seems to suggest so.

If it keeps going up then the bears are caught out this analysis was wrong and I would enter long and then probably get stuffed on the other side aswell! :devilish:

No but seriously thats the way I see the situation. Obviously as more time passes I will see what happens and assess the chart then.

What do others think?
 
User - you made an excellent short call at the start of January, but referring to the charts (as you do..... ;) ) I can't see anything to suggest it's going in any other direction but up....!

Still, things can change fast and any comments on direction, backed by charts or otherwise, are mere *speculation* at the end of the day......it doesn't move in straight lines, and could backtrack at any time...... :)

Good Luck...!
 
Thanks for the luck tradesmart.

I agree its going up from its base at 10400, but its approaching some difficult levels ahead. If it moves higher and higher then no doubt deicisions would need to be made in relation to the chart and some handy indicators will be taken into consideration.

ChowClown on your chart you used a Slow STO and I noticed everytime it turned over 80 the Dow moved lower. How well does that work with your 60 minute charts?
 
tradesmart said:
User - you made an excellent short call at the start of January, but referring to the charts (as you do..... ;) ) I can't see anything to suggest it's going in any other direction but up....!

Hi TS

There seem to be a lot of similar views across the boards that see resistance at 650 level. Clearly this would be based on longer chart time frames, also if 650 is resistance and we see a move down to support agn at say 400. Would this not take us to within a gnats of a major break South ?

Would you care to expand on your idea that the Dow is heading North, as i can't see the case for it .

D'ont get me wrong on this, North or South, it does'nt really matter in the slightest, as long as it does something !!!!! :LOL:
 
Hi CV

I’ve posted charts and comments to back my bullish observations on Chartman's Dow charts thread this week, so to avoid duplication I’ll refer you to that….

As far as levels go, there are clear bands of resistance on the way up assuming that the target is a retest of the high 10800’s, but if the buying is strong, this need not stall the ascent……

Conversely, if the bears get the upper hand and established support at 10375 ish fails – it could clearly pitch the Dow into the abyss…..

As long as I’m on the right side of the trend, I’m happy either way……. ;)
 
I think TS just means North is the current direction since Friday's support formation of 10400. TS maybe you see the current upward move more significant as you may trade ST or intra. On longer term charts its only 200 points.

With the DOW having a Average True range of around 90 points or so. This 200 point move so far is only around 2 days work and not too significant at the moment.

However if we were to breach the rough level of 10630 to 10650 which counter_violent has mentioned then that would be of more significance for upward action and that is if it closes above that level not intraday touches.

One things for sure the direction on a daily chart is in the balance.

For Wednesday’s action 10575 should lead us to test 10600.

Thursday Action - Gains for the indicies as the Dow closes below resitance level. For upside movement, consolidation at these levels would be good for continuation of the upward action.

A move below 10575 could bring us back to 10550. A break below 10530 should lead us to 10500.

An early push through 10630 could lead us to 10650.

Goodluck
 
A move below 10575 could bring us back to 10550.

That happened but we found support at that level and reversed to the upside ending the session with a tiny 2point loss. Still below our resistance of 10600-30-50.

The Nasdaq on the other hand had a strong down day and even though the other indicies came of the lows the Nasdaq remained weak and closed near the lows. I have mentioned this before for: When the Nasdaqs gains or losses differ from the other two then this is significant as I believe the Nasdaq is the leader on the way down and on the up. Could it be that we are heading lower again in the short run?

Fridays action - As we basically ended up where we started yesterdays levels for catching the moves can be used.

Goodluck
 
User, i don't use the stoch exclusively but you're right, on the hrlies it's a fairly reliable heads-up. I'm fond of this daily chart too. I look for the stoch (39,1,1) to move through 50 and volume to confirm direction. You can see on this latest swing, the stoch has yet to breach 50 and the volume is lack lustre. Today's NFP etc will hopefully restore some decent price action.

user said:
ChowClown on your chart you used a Slow STO and I noticed everytime it turned over 80 the Dow moved lower. How well does that work with your 60 minute charts?
 

Attachments

  • Daily DOW - 3 Feb.gif
    Daily DOW - 3 Feb.gif
    22.6 KB · Views: 317
Is the indicator not suggesting higher action on the daily chart as you sell when over 80? Seems like its about to breach 50 as looking at the past data it only ever failed once when its as close as it is now to breaching 50? What does your analysis suggest as I don't normally use this indicator?
 
Jobs data missed expectations, previous months figure revised down. Manufacturing jobs lost. However a flat reaction on the Dow futures but we have moved slightly lower from the highs. Currently sitting at around yesterdays close. Lets see what happens at the open. Watch Fridays figures for direction. My currency trades on the other hand are moving rampantly!

Good luck
 
..i've tried anticipating this chart before and was stung badly. For position trades i now wait for OBV to cross it's MA plus stoch thru 50. I'm waiting for both to line up, which could be today, but you never know.
 
Yes its best to confirm but I was just talking in terms of what its done in the past in terms of your chart posted. Let me know how it shapes up. Goodluck
 
Failure of 10600 at this moment in time could well lead a decline today.
 
CJIA yes it could well reverse at 10650 but for the time being it is holding well. We see how it shapes up.
 
A very strong solid rally yesterday. Thats finished any chance of a head and shoulders pattern. With a rally like that a test to the highs seems imminent.

The Dow closed above the 10630 area for the first time in over a month. It even closed above 10700 with that strong rally yesterday. At this moment in time we should be buying the Dow.

However I'm still reluctant.

On the other hand the VIX went to new lows yesterday.

See attachment.
 

Attachments

  • VIX.JPG
    VIX.JPG
    73.7 KB · Views: 261
user said:
A very strong solid rally yesterday. Thats finished any chance of a head and shoulders pattern. With a rally like that a test to the highs seems imminent.

The Dow closed above the 10630 area for the first time in over a month. It even closed above 10700 with that strong rally yesterday. At this moment in time we should be buying the Dow.

However I'm still reluctant.

lol ok i'll stick my neck out.

A pattern does'nt have to be exact, as many are not, also the DOW would need to hold on to this gain. A fall and close back below 650 might then show this to be a spike high or bull trap, whatever you prefer. If we then take this a stage further, lots of traders might not spot or believe the downside action due to irregular pattern formation.

I can understand your reluctance to go long, I will be sitting firmly on the fence here untill we see some action either way . :rolleyes:

counter
 
Top