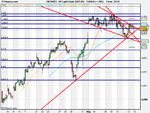
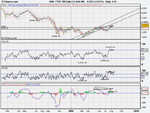
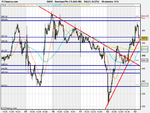
MACD showing bearish move coming up.
Histogram divergence with macd line slope.
Histogram divergence with Price also.
Macd line (peaks) divergence with price (from mid may) this long term signal is more reliable i think.
Bearish div on histogram signalled the moving average crossover of MACD line with 9EMA....bearish crossover. Just happened.
Centre line has just crossed down = bearish.
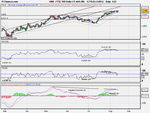
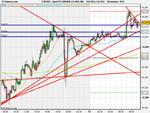
They say MACD is good for trending markets. And RSI is good for ranging markets.
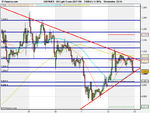
But what is the ftse doing? trending or ranging?
its trending since mid july 2009. But it was ranging before that for 2 months.
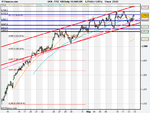
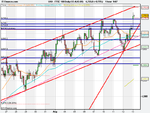
Or do we look at Weekly chart to determine whether its ranging or trending?
weekly shows trending up from april 2009.
(i took blix's suggestion, reading and learning with articles elsewhere more so now.
And reading Trading in the Zone...i feel calm now.
Sorry blix, i know you said to ditch MACD, but ive just got to grips with it today: reading up on it all day...im exploring it for myself first, as you can see...i quite like it)