Wallstreet1928 Analysis & live calls on FTSE,DAX,S&P...aimed to help New traders

Status
Not open for further replies.
s500...15 min data
a mini triangle that broke upwards.these can recoil backwards
a break to 1060 makes this chart bearish

2wdzixk.png
 
Dentist you are right, my sleeping patterns really are screwed

Oh well,

I am going to start a wisdom quote of the day series, it will help you become very introspective

"If you haven't really struggled with a question, you cannot digest the answer even if it is handed to you."


I'm sure we will all look forward to Dr Blix's commentary on the daily quotes ..........
 
John Murphy | The Market Message
FALLING DOLLAR FAVORS FOREIGN STOCKS
Arthur Hill reviewed some standard intermarket relationships on Thursday. One of the best known is the inverse relationship between the U.S. Dollar and commodity prices. That's why a falling dollar has had a bullish impact on commodity prices since the spring. The falling dollar has also boosted global stocks as money moved out of that safe-haven currency into riskier assets like stocks. But not all stocks rise equally at such times. A falling dollar has a much more bullish impact on foreign stocks. Since the March top in the dollar, for example, the S&P 500 has risen 56%. Foreign stocks, however, gained 72%. The stronger foreign performance was due largely to the falling dollar. The red line in the chart below is a ratio of the Morgan Stanley World Index (Ex USA) and the S&P 500. The green line is the U.S. Dollar Index. The inverse relationship between the two lines is very clear. Foreign stocks did much better than the U.S. from 2002 to the end of 2007 while the dollar was falling. Foreign stocks did much worse than the U.S. during the second half of 2008 as the dollar rallied. The dollar peaked in March of this year and has been falling since then. The rising ratio shows foreign stocks outpacing the U.S. since the dollar top in March. A weaker dollar favors heavier exposure in foreign stocks. The direction of the dollar also determines when it's better to use foreign ETFs.


10cvnzb.png
 
Carl Swenlin | DecisionPoint
BULL MARKET RULES STILL APPLY
For weeks we have been looking for a correction, and a time or two we experienced some trepidation that the bull market might be over, but all the market has done is produce a series of minor pullbacks. At the present it is trying to break out of a rising wedge formation, the opposite of what we normally expect with a bearish formation. This kind of behavior continues to supply us with evidence that bull market rules still apply. That means that we should continue to expect bullish resolutions rather than bearish ones

w9uq75.png
 
Bottom Line: Many market indicators are overbought and topping, presenting us with yet another setup for a correction, but bull market rules say we shouldn't count on it. A small pullback is more likely. To be sure, our bullish assumptions will ultimately prove wrong when the final top of this rally arrives, but our trend following models keep us from pulling the trigger prematurely. We remain on a 3/17/2009 medium-term buy signal for the S&P 500.
from chartwatchers newsletter
 
Bottom Line: Many market indicators are overbought and topping, presenting us with yet another setup for a correction, but bull market rules say we shouldn't count on it. A small pullback is more likely. To be sure, our bullish assumptions will ultimately prove wrong when the final top of this rally arrives, but our trend following models keep us from pulling the trigger prematurely. We remain on a 3/17/2009 medium-term buy signal for the S&P 500.

ju96h5.png


from arthur hill
 
Thomas J. Bowley | Invested Central
AS RISKS RISE, DISCIPLINE AND STOCK SELECTION ARE CRITICAL
In a perfect world, we'd all invest every dime in winning stocks each and every trading day. Unfortunately, I haven't seen that kind of trading world yet. So as we approach each day, we must assess the risks in the market and determine an appropriate trading strategy. At times, it makes good sense to go "all in". But most of the time, the nature and size of our trades should be based on the risks inherent in the market. I've discussed some caution of late and I maintain it. It doesn't mean the market cannot go higher and that you cannot trade on the long side. It simply means you should do so much more selectively and with stops in place.
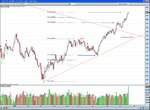
The good news is that price/volume trends remain very strong and this indicator is the most important of all, bar none. There's a laundry list of negatives that we must respect though. The MACD has been negative on the daily chart across all of our major indices for the last 3-4 weeks. There's also a negative divergence on the 60 minute charts, as the NASDAQ chart below shows:


10z0n7a.png


Stochastics and RSI are both near-term overbought across our indices as well. They could use a pullback to help consolidate recent gains. Without a pullback, the overbought conditions last longer and generally encourage a steeper selloff when one finally occurs. I'd prefer to see a little unwinding of these oscillators now rather than later. Historically, we've entered the third worst period of the year on the S&P 500. Only one week periods in October and July have produced worse results historically than the period we're in. So far, this period is holding up well, but we have another week or so to negotiate before we can call it a success.
Finally, and perhaps most importantly, the masses are jumping into equity options on the call side. This is a MAJOR warning sign to me as retail traders, unfortunately, rarely walk away with the pot of gold. The Friday that options expire usually carries very heavy volume on both the equity call and equity put side. I tend to follow the equity call and put activity on days other than option expiration Fridays. In early May, I saw record levels of equity calls traded. In fact, May 7th (this day marked the top for awhile) held the record for most equity calls traded on a non-option expiration Friday. When longs start to believe the market cannot go lower, it does. The May 7th record of equity calls traded was broken this past Wednesday, September 16th, then challenged again on Thursday. I'm seeing way too much complacency in the market. I've seen many in the media saying that no one believes the market can go higher, therefore it will. While that's nice to say, I simply can't find proof of that by looking at options. I'm seeing the exact opposite - equity option traders don't believe the market can go DOWN. That ALWAYS makes me nervous.
Can the market go higher from here? Absolutely, and without a trace of pullback too. Overbought can stay overbought. There are NO guarantees in the market. Would I be "all in" expecting that continued bullish behavior? Absolutely NOT. The risks are too high. I believe you have to be very, very selective in trading the market at this level. While shorting has been a practice in futility for several months, the money has been made on the long side during this stretch. I continue to look for the stocks with the very best volume trends, suggesting accumulation. The best time to enter those stocks is either just as they make a new breakout on confirming volume OR on a pullback to retest a previous breakout level or a major moving average. Personally, I prefer the latter as risks are better and more easily controlled. One feature that we've added at Invested Central over the past 6-7 weeks is a Chart of the Day. These charts are designed to be highly educational and they focus on finding candidates that possess many of the reward to risk characteristics that I look for. You can check these charts out daily at CLICK HERE (http://www.investedcentral.com/public/975.cfm).
During our national radio broadcast, we discuss the Chart of the Day as well at 8:42am EST. CLICK HERE (http://www.marketopenlive.com) to follow us LIVE on the air each and every trading day from 8:00am-10:00am Monday thru Friday.
 
WS - I like your USD/JPY call it fits with my Vantagepoint but is one day from set up i.e. have 2 out of 3 parts a rise of a few pips on Monday would confirm the trend and I'll be looking to enter Tuesday.
 
"If you haven't really struggled with a question, you cannot digest the answer even if it is handed to you."


I'm sure we will all look forward to Dr Blix's commentary on the daily quotes ..........

i'm a bit of a sucker for introspective philosophical quotations, look forward to reading them. :)
 
Something argueably more useful than random quotes, a FTSE chart.

Interesting to observe the turn at the 61.8% fib back in early July, and the hesitation at the 138.2 fib extension in late august. The last extension on the chart is the 161.8% - but does it mark the top, I doubt it, because this market is on drugs :)

Good luck all for next!

p.s. I am not sure the volume data is accurate.
 

Attachments

  • ft_daily_fib.jpg
    ft_daily_fib.jpg
    148.9 KB · Views: 117
paulhclark
been reading reveiws on elitetrader about vantagepoint.they all say it is an ema combination that gives signals.not much intermarket analysis
do you trade eod or intraday from it..??
 
IMF Selling One Eighth Of Its Gold Reserves, Will "Safeguard Against Disruption Of The Gold Market"

In what can only be called a rather surprising development, the IMF has disclosed it is selling 403 metric tons of gold, or about one eighth of its total gold holdings. The reason: to continue providing lending to the poorest countries. Just so readers visualize who these "poorest countries" are, and who this current manipulation in the gold market will presumably benefit, here is a map of the IMF's most recent activities:

From the IMF:

“I am delighted that the Executive Board has given its overwhelming backing to a strictly limited sale of Fund gold to put the financing of the IMF on a sound long-term footing, and enable us to step up much-needed concessional lending to the poorest countries,” Managing Director Mr. Dominique Strauss-Kahn stated. “These sales will be conducted in a responsible and transparent manner that avoids disruption of the gold market. Most importantly, the sales are strictly limited to 403.3 metric tons, which is one-eighth of the Fund’s total holdings, so the IMF will continue to hold a relatively large amount of its assets in gold.”

The new income model is designed to provide the Fund with more diverse income sources that are better aligned with the variety of functions performed by the Fund, with a central component being the funding of an endowment with the profits from these limited gold sales. Resources linked to the gold sales will also be used indirectly to increase the Fund’s capacity to provide concessional loans to low-income countries (see Press Release No. 09/268).

The gold sales could be conducted on-market in a phased manner over time, following the approach adopted successfully by the central banks participating in the Central Bank Gold Agreement. Participants in the recently renewed agreement announced ceilings on sales of 400 tons annually, and 2,000 tons in total during the five years starting on 27 September 2009, and noted that the Fund’s sales can be accommodated under these ceilings. Hence, on-market gold sales by the Fund will not add to the announced volume of official sales.

As one of the elements of transparency, the Fund will inform markets before any on-market sales commence. In addition, the Fund will report regularly to the public on the progress with the gold sales.
Conclusion: even more forced capital reallocation disguised as a "transparency" boosting initiative. Next up: rioting in Goldbugland.
 
I like your FTSE chart Geofract


weekly chart

50.0% fib retrace at ............5112

61.8% fib retrace at....... 5502

Trend line coincides with 5400

Must wait for weakness

BP .............failure @ 560 will be an early signal
 

Attachments

  • FTSE 100 Daily (18-SEP-09).png
    FTSE 100 Daily (18-SEP-09).png
    20.7 KB · Views: 143
Last edited:
Something argueably more useful than random quotes, a FTSE chart.

Interesting to observe the turn at the 61.8% fib back in early July, and the hesitation at the 138.2 fib extension in late august. The last extension on the chart is the 161.8% - but does it mark the top, I doubt it, because this market is on drugs :)

Good luck all for next!

p.s. I am not sure the volume data is accurate.

Channel that TL (y)
 
Status
Not open for further replies.
Top