Trading the NQ

I've been asked why it matters whether or not one has spent (wasted?) time watching price move, particularly if he's not daytrading. After all, daily (weekly, monthly) charts don't move; they're just there, take them or leave them.

I suppose it has to do with depth of knowledge. I don't post anywhere else. It's too much bother and has little to no result, largely because the signal to noise ratio is so extreme. But I do read a lot of posts, and it's clear to me that very few people -- very few people -- have any idea what's going on in front of them, which is likely why their charts are so filled with lines and colors and shapes of one sort or another in so many windows it's next to impossible to make sense of whatever information they're seeking to provide themselves. If their charts had sound, they'd be a rock concert with the volume set at 11.

Which brings me back to depth of knowledge. Not breadth. Depth. Think of someone who is viewing photographs of the ocean. This someone has been to the seashore, collected shells, waded in the ocean, sailed a boat, paddled a canoe, traveled on a ferry or a ship. He's going to have a very different reaction to these photographs than someone who's never even been to the beach, much less set foot in the water. The movement of the water, of the currents, of the wind and its effects on the water play no part in his perceptions because he's never experienced them. His perceptions don't have the depth of the person who's intimately familiar with the water.

It's not too much of a stretch to apply this to chart-reading. Wyckoff began as a tape reader. Therefore, everything he says about price movement on charts is informed by that experience, whether of support, resistance, turning points, strength, weakness, trend, or any other aspect of movement. He sees price even on a daily chart as something that is fluid, in constant motion, something that is the result of a never-ending back-and-forth among buyers and sellers. Does the depth of this knowledge affect the judgments that are made regarding what is seen on the chart? Given the confusion and misunderstandings I encounter in countless posts that result from the absence of this depth, I have to say yes.

And so I continue to suggest that those who want to be successful traders as opposed to those who are just looking for something to pass the time spend at least a little of that time watching price move. If the experience has no effect on how one views his daily chart, then so be it. What does one have to lose?

Two obvious reasons that come to mind.
1) A trader watching 5 min bars in a month would have spent more time watching price movements than someone watching daily bars over three years. Nothing beats hard work if you want to succeed in this business.
2)Trading is about the right side of the chart. Looking at daily bars is reading history. Try watching 1 min bars in development and you are as close to price reading in action as any training you can get out there.

A trader watching 5m bars will not likely learn much if anything about price movement since intraday prices move in a continuous series of ticks, not bars (see, again, this thread, particularly post #5). If he wants to learn how to trade bars, fine. If he wants to trade price, watching intraday bars will be pretty much a waste of time since intraday bars exist only in the imagination.

As for the right side of the chart, yes, trades are made on the right side of the chart. But if one trades the right side without having any idea how he got there, his trades will be ignorant and the outcome a product of chance. As for 1m bars, they, like 5m bars or any of the other software defaults, are a fiction and will train him to trade bars, not price. This is the chief reason why virtually none of the so-called "price action" traders actually trade price.

You have lost me on your post. Intra day prices are imagination and friction. This is deeper than the world of Matrix. If price bars are not price then what is it we are trading?
 
You have lost me on your post. Intra day prices are imagination and friction. This is deeper than the world of Matrix. If price bars are not price then what is it we are trading?

Intraday prices are not imaginary. Intraday price bars are. They are the product of software engineers' efforts in the 80s to create digital intraday charts for institutions and for retail traders who can afford the software. The defaults -- 1m, 5m, 15m etc -- are a convenience and nothing more. Any default could have been selected. Which is why the reams of posts and articles and books that have been posted and published about multiple intraday "timeframes" and fractals are nonsense. There is only one intraday timeframe: from the opening trade to the closing trade* (for futures, it's five days). During that time, trading is continuous. There are no closes.

If you're lost, I suggest yet again that you read post #5 in the Trading Price thread. As for The Matrix, I begin the Trading Price thread as follows:

Trading price requires a perceptual and conceptual readjustment that is somewhat like parting a veil -- or taking the red pill -- in that doing so enables one to look at the market in a very different way, one might say on a different level.

One must first accept the continuous nature of the market, the continuity of price, of transactions, of the trading activity that results in those transactions. The market exists independently of you and of whatever you're using to impose a conceptual structure. It exists independently of your charts and your indicators and your bars and your fanciful shapes. It couldn't care less if you use candles or bars or plot this or that line or select a 5m bar interval or 8 or 23 or weekly or monthly or even use charts at all. And while you may attach great importance to where and how a particular bar -- or candle -- closes, there is in fact no "close" during the market day, not until everybody turns out the lights and goes home (if you trade futures. there's no close until the end of the week).

Therefore, trading price, or at least doing it well, requires getting past all that and perceiving price movement and the balance between buying pressure and selling pressure independently of the medium used to illustrate the activity.


*Not all daytraders trade the entire session. Some/many trade only the first half hour, or 90 minutes, or two hours or the last two hours. These segments become their timeframes, the frames in which they trade. But five minutes is not a timeframe, unless one is trading for only five minutes. It is an interval, or a segment, or whatever other word one chooses to describe a particular portion of the trading day.
 
I've mentioned that the chief reason for looking at larger intervals such as the daily and weekly is that these are where The Money resides, and if one trades with them rather than against them, he is more likely to be in for a pleasant ride.

It is reasonable to assume that many eyes are on the last swing high on the daily and weekly which happens to be the same for both: 6130-33. It will be interesting to see what big traders do if and when we get there.
 
the red pill is starting to take effect :D (y)

6130 was indeed interesting! i hope you caught some db i was sat at my desk at work unfortunately..

brumby has his own view on charts unsurprisingly but hes kinda like you in having an excellent understanding of trading and explaining it well
 
Last edited:
There is a payoff to simplicity. Wednesday afternoon I pointed out (post 157) that we were in the process of testing the October high. This test was completed an hour later. Whether or not the trader bought that was his choice.

This afternoon, I pointed out that the last swing high on the daily -- 6130 -- would likely be important to institutional traders, and a few minutes later we broke through that level, eventually moving 189 points (62 equivalent ES points). Just price and volume.
 
Intraday prices are not imaginary. Intraday price bars are. They are the product of software engineers' efforts in the 80s to create digital intraday charts for institutions and for retail traders who can afford the software. The defaults -- 1m, 5m, 15m etc -- are a convenience and nothing more. Any default could have been selected. Which is why the reams of posts and articles and books that have been posted and published about multiple intraday "timeframes" and fractals are nonsense. There is only one intraday timeframe: from the opening trade to the closing trade* (for futures, it's five days). During that time, trading is continuous. There are no closes.
I am starting to get a glimpse into your reasoning. However I do not agree with your conclusion based both on your premise and opinion.
Your opinion about the imaginary nature of intra day bars is based on the premise of a lack of an “official” close number found in intra day bars in contrast to an official close as reflected in a daily bar. In any reasonable logical argument , the conclusion must follow the premise. You are basically concluding from your premise that the lack of an official close in intra day bars makes intra day TF and fractals nonsense. You need to demonstrate nexus between the lack of an official close in intra day prices as nonsense for trading and not simply a brute statement. The other pertinent question is what makes “official” and “non official” close such a big deal in your overall argument? It may be that the closing prices in intra day bars is a function of convenience but it doesn’t make them nonsense for trading as you advocate.
One must first accept the continuous nature of the market, the continuity of price, of transactions, of the trading activity that results in those transactions. The market exists independently of you and of whatever you're using to impose a conceptual structure. It exists independently of your charts and your indicators and your bars and your fanciful shapes. It couldn't care less if you use candles or bars or plot this or that line or select a 5m bar interval or 8 or 23 or weekly or monthly or even use charts at all. And while you may attach great importance to where and how a particular bar -- or candle -- closes, there is in fact no "close" during the market day, not until everybody turns out the lights and goes home (if you trade futures. there's no close until the end of the week).
Therefore, trading price, or at least doing it well, requires getting past all that and perceiving price movement and the balance between buying pressure and selling pressure independently of the medium used to illustrate the activity.
I don’t see anywhere in your statements that support your conclusion that intra day bars are nonsense in trading. In trading, it is not about how price bars are presented but how it is interpreted and then trading decisions made.
 
Intraday price movement is continuous. There are therefore no closes -- official or otherwise -- and no bars. If one segments his day in some way or other (3m, 8m) or collects the data he receives into bars, that is his choice, but it has nothing to do with the nature of intraday data. One can manufacture an alternate reality for himself if he so chooses, but if one is going to trade price intraday, it is best to stick as closely to the reality of intraday price movement as possible.

I suggest you spend some time reading the tape.
 
Bars often mask more than they reveal, particularly when it comes to intraday movement. While line charts can seem like a foreign language, particularly to post-'97 traders, they do offer a clarity that makes experimenting with them worthwhile.

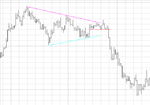
Some aspects of reading real-time price movement are pretty much as difficult as they are with bars. Higher lows, lower highs, double tops, double bottoms are relatively easy to detect in real time. The ever-changing balance between buying pressure and selling pressure, on the other hand, presents greater challenges, as does gauging strength and weakness. Climaxes & tests and hinges provide important information, but one must also be sensitive to the story that price is trying to tell. A climax, for example, doesn't necessarily mean reversal; it can mean nothing more than exhaustion and an eventual sideways drift (trending, ranging, trending, ranging).

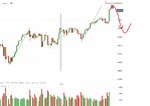
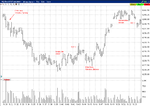
First, price breaks through the last daily/weekly swing high. The important money had seen the reversal on Wednesday (see post #157) and all eyes are on this breakthrough. Can it hold? Everybody's watching everybody else. It slips back below this level by a few points, but makes a double bottom and rallies back into a new high.

Volume is strong during this ascent, a reflection of the amount of both selling pressure and buying pressure. But price is ascendant, so demand has the upper hand. This is confirmed by the rapid dropoff in volume beginning at 1000. Some traders would call this a divergence and expect a reversal in price. But there's no divergence here, rather a withdrawal of supply. This enables price to rise with relatively little effort.

This initial thrust then wraps itself up for a consolidation, or rest, or breather, what one might call a natural close to the effort since those who initiated this and those who got in early will now be lightening up their positions or exiting them entirely. However, volume is even less than it was on the way up and price maintains its steady state, so there's no cause for concern even though price has moved nearly fifty points. Selling is calm, not frantic.

Volume then re-enters and price rises into a new effort, so the volume reflects buying pressure (there is of course an increase in selling pressure as well, hence the increase in volume, but since price rises, the buying pressure is greater). Price makes a double top with the high of the initial effort, which is cause for concern given the extent of this move, but it slips back by only half, suggesting strength. Given that volume falls off again, there's no reason to exit here.

Volume then re-enters big-time at 1100 and price is again propelled higher. This time, however, the angle of ascent is far less steep than that of the first move up. Finding buyers becomes more difficult. Volume again diverges with price, but supply is still minimal and does not impede demand. The move up isn't quite as effortless, but it is getting tired. Those who are paying attention to the angle of this ascent are put on notice.

Price then folds back on itself from 1230 to 1300. One could exit here, but the severe dryup in volume might encourage him to wait and see. When price resumes its rally on slightly better volume, the trader sees that it has moved beyond the halfway point of the decline, suggesting strength. Buyers then propel price to nearly 6225, at which point volume finally picks up. The bottom falls out of volume, however, when price tests the last swing high at 1245+/-.

So now what? Price has moved over 200pts in only three days, so a little profit-taking would not be unexpected. Price moved 250pts over four days in late August and retraced half the move over the next two days. We could do the same here, taking us back to what was the October swing high. If price makes its way toward 6250, I'd keep my eyes open.
 

Attachments

  • Image5.png
    Image5.png
    66.3 KB · Views: 169
".........So now what? Price has moved over 200pts in only three days, so a little profit-taking would not be unexpected. Price moved 250pts over four days in late August and retraced half the move over the next two days. We could do the same here, taking us back to what was the October swing high. If price makes its way toward 6250, I'd keep my eyes open................

Friday’s rise was equivalent to around 700 points on DOW which has got to be exuberant in anyone’s language. Tempting to think it’s well overdone but It’s only recovered all its recent weakness compared to DOW albeit in one fell swoop. Closed near highs with all the profit taking absorbed and people being prepared to take the risk of holding over the weekend. That’s a strong finish.

We’re in clear air so there’s no historic points of reference to work from. As you say, got to wait for some to emerge I guess unless just taking a flyer. Tonight’s open might be informative.
 
There are historic points of reference with regard to behavior, which is pretty much all I've been interested in for some time. People will avoid going long because they view the market as being so "high". But whether or not the market is "high" is not as important as whether or not one can find willing buyers. Whether or not those willing buyers on Friday were simply covering shorts doesn't matter in terms of the price rise. What does matter in terms of short-covering is that those people are now no longer holding anything; they're out of the market. And to support the price up here when it begins to roll over will require buyers, not short-coverers as the short-coverers have already covered.

O'Neil was in one way right about new highs offering no resistance as there's nothing above them to impede their progress. But the resistance at new highs is not previous trades but rather fear, which prevents many people from buying in until they capitulate and you get the melt-up. Focusing on behavior rather than forms of illustration (bars, candles, clouds, etc) has made all of this so much simpler and even easier (though the "easier" state isn't easy to achieve, if that makes any sense).

There was some expectation in certain quarters that the market would collapse if the oligarchs didn't get their tax cuts, but at this point it really doesn't matter whether they get them or not. The challenge going forward is finding willing buyers, and there may be none regardless. It's the old "buy the rumor, sell the fact" dynamic. Which is one reason why I don't even bother following PE anymore.
 
So now what? Price has moved over 200pts in only three days, so a little profit-taking would not be unexpected. Price moved 250pts over four days in late August and retraced half the move over the next two days. We could do the same here, taking us back to what was the October swing high. If price makes its way toward 6250, I'd keep my eyes open.

The NQ appears to have topped out at 6251.5, so I was off by six ticks.

Oh, well . . .

;)
 
The NQ appears to have topped out at 6251.5, so I was off by six ticks.

Oh, well . . .

;)


Good call, time and price gave the same levels/dates (thus far) - (posted Saturday another thread), not sure if this is something you watch for/incorporate alongside Wykoff?
 

Attachments

  • NQ.jpg
    NQ.jpg
    115.9 KB · Views: 141
I've been asked about discipline:

A setup is a set of circumstances which the trader defines which triggers an entry. It's up to him to

(a) impose order on the data stream;
(b) find the markers of buying and selling interest, buying and selling pressure, buying and selling exhaustion;
(c) test them to determine whether they show a higher probability of trading success than a random entry;
(d) decide exactly what it is he wants to see before entering a trade.​

That's his "setup". No magic required.

If you enter a trade because you see your setup, you are trading. If you enter a trade without seeing a setup, because it “feels” right, you are gambling. You might lose on a "trading" trade and you might win on a "gambling" trade, but in the long run you will lose if you go for pure action without any attempts to identify the setup.

When the trade shows a familiar situation, that's where you get probabilities on your side. You have to ignore everything that moves in a way that doesn’t allow you to read the movement within your system.

Scenarios are built in such a way that any kind of market action triggers one of your reactions. Let the market tell you what to do.

After your set of scenarios is done, you have pretty much "programmed" your behavior and they become your psychological support. You have already predetermined your stop level and assumed the risk, so if the stock acts nasty, you’re not caught off guard; it's merely one of your scenarios. Knowing that you were not trying to predict anything, you take it calmly. If the stock goes in your favor, you know what to do next and there is no room foroverexcitement. Rather another set of scenarios kicks in. If it doesn’t go in your favor, another set of scenarios kicks in. After the trade is closed, you go back to monitoring and looking for activity.

As a daytrader, you spend much more time on the sidelines, waiting for the right opportunity to present itself. You are filtering out everything that

1. Doesn't fit your risk criteria.
2. Moves in a way that doesn't allow you to identify a familiar setup.
3. Sets up but still doesn't trigger the trade. This means, for example, that if you want to short under the price but the price rallies instead, your short is never triggered.​

You structure your own behavior. Eventually, that is what disciplines you and creates a favorable environment for getting rid of emotional imbalances. When you act within predetermined scenarios, you don't let actions trigger your ego. Ego raises its head when you expect the stock to do something and it does the opposite. If you don't expect anything but are ready for any turn of events, nothing wakes the ego.

Attempts to jump on everything that moves leads to inevitable frustration as stocks act randomly for a trader doing this. They can't act any different because he looks at them randomly, so he takes the trades randomly. As soon as the trader has formed a system of setups and scenarios, where the setup is the trigger for the action and the scenario is the algorithm of the action, his behavior ceases to be chaotic and moves from gambling to trading.

– Vad Graifer
 
An effortless morning for the SLA.

Climaxes and tests and hinges, oh my!
 

Attachments

  • Image18.png
    Image18.png
    42.7 KB · Views: 1,627
  • Image19.png
    Image19.png
    44.6 KB · Views: 218
If you find yourself with a lot of breakeven trades or small losses, zoom out:
 

Attachments

  • Image10.png
    Image10.png
    12.3 KB · Views: 224
Top