dbphoenix
Guest Author
- Messages
- 6,954
- Likes
- 1,266
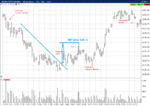
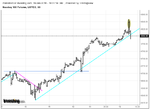
Price falls out of the hinge just after 1031 and there's a retracement, which provides the opportunity to enter a short. However, the sellstop is never triggered because price doesn't fall far enough. So, patience.
The stride is then broken, so I look for an opportunity to go long. Price falls, makes a higher low, and I enter five points above this level. Price then re-enters the range and stalls at the median, which is where I retire (and price waffles around here for nearly two hours).
The stride is then broken, so I look for an opportunity to go long. Price falls, makes a higher low, and I enter five points above this level. Price then re-enters the range and stalls at the median, which is where I retire (and price waffles around here for nearly two hours).