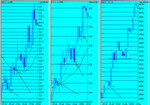
Take a look at the 3 charts, NQ and ES futs, and the dow. ES and NQ show 10 ESA (light) and 21 ST MA ( dark). In this particular instance, ES was leading NQ by virtue of the MA crossovers. On the dow( not shown) the MA's crossed over at 15:38 at 8606. The MA shown on the dow is the 100 ESA - "the safe buy level".
The ES shows on the left hand side the 2 MA's crossing at just below 894. This is the 5th tick in from the left and is an up tick. The dow is still doing a down tick.NQ has also done an up tick.
The buy signal will come from the fact that the 2 MA's are about to cross and the first sign of an up tick in ES. The NQ Ma's didn't cross until a few ticks later. Now you're in. The trick is now to find the pullbacks and add to your position. These are arrowed on the ES chart. Look how the volatility on ES compared to Dow. Assuming a nominal 10 points worth ES to dow 1 point , you can see that a particular move on ES DOES NOT get reflected back to the dow's move. You must allow for the fact that the dow is "happening" about 1 tick later than the ES/NQ.
You can't quite see it on this example, but a big pull back occured just after this.( dow dropped from 8682 to 8655). ES dropped the equivalent ( 903 1/4 to 900 1/4) but at this low, the two MA's never crossed and there was not one full down tick below the 21MA. The first <MA crossover on ES was at 16:40. that was at dow 8720. Entering/exiting this move at the ES MA cross was worth 120 points. Taking an overall view, trading the 10/21 MA cross from just the dow will cost you 20 points or so. Trading it from ES will just give you the edge on the bias BUT you have to be quick. If you are nervous or not sure, you will still not beat the bias. Remember there are occaisions in a big move up that the dow is ahead of the SB's. You will see that the SB bias is barely above the dow cash price and fails to move for several ticks. Dont be fooled into selling just because the bias has dropped back. It just means that the dow stocks are leading the way, and ultimately ES ( and hence SB's ) have to follow. I have seen SB's fall 15 below the uptrending dow, without the down tick in ES and been tempted to add at the bargain price. 🙂 Next time....

