Trading the NQ

Bottom in?

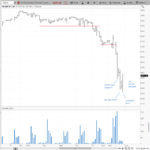
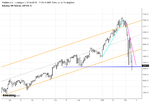
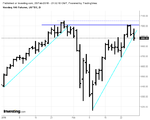
Can a selling climax occur on low overnight volume (low relative to the regular session but highish for overnight)? Is 2H chart long enough interval for analyzing move this size? (chart 1)

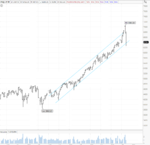
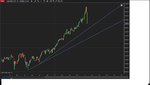
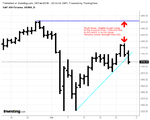
Weekly demand line seems to be holding for now. (chart 2)

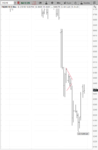
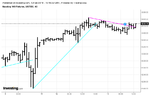
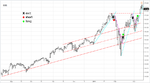
Watching 6445 on 30 min for turn back down and test of lows. (just blew thru it) (chart 3)

Possibly all moot once market opens but interested in how others are seeing it.
 

Attachments

  • 2H.PNG
    2H.PNG
    44.6 KB · Views: 169
  • weekly.PNG
    weekly.PNG
    43.6 KB · Views: 149
  • 30 min.PNG
    30 min.PNG
    26.6 KB · Views: 150
Those who've studied the book will understand that price will likely bounce around this level of the weekly channel, which began in Nov '16, for anywhere from a few days to a few weeks or months. Again, those who cannot daytrade and who cannot tolerate the risk involved in placing the cover stop at the DP should take another look at the Q.

I see that this thread has racked up another 12000 views since my last entry, so clearly it is of interest to guests. I wish them well, wherever they're posting, if anywhere. The two threads below will also be of interest to them:

Trading Price

The Wyckoff Method
 

Attachments

  • Image4.png
    Image4.png
    91.9 KB · Views: 464
Price is extended quite a bit below the lower part of TC. Daily is also showing a new down trend. I am looking horizontally to keep my head straight here and giving credence to the idea that the price has shot quite a bit to the downside and may recoil towards the median. It is debatable how valid the TC is after such wild moves out of it. Then again the night does look darkest before the dawn.
 

Attachments

  • NQ Daily.png
    NQ Daily.png
    54.2 KB · Views: 163
That particular channel is no longer pertinent. Look to the next lower channel.
 
Price is extended quite a bit below the lower part of TC. Daily is also showing a new down trend. I am looking horizontally to keep my head straight here and giving credence to the idea that the price has shot quite a bit to the downside and may recoil towards the median. It is debatable how valid the TC is after such wild moves out of it. Then again the night does look darkest before the dawn.

weekly channel
 

Attachments

  • NQ Weekly.png
    NQ Weekly.png
    99.4 KB · Views: 208
NQ hourly. One doesn't need to become a master of reading price action to have an idea about which direction offers better odds.
 

Attachments

  • NQ hourly.png
    NQ hourly.png
    34.7 KB · Views: 191
Price cracked through the demand line in pre-market hours. At the open the price is above the entry but based on one's sell rules some may exit and some may do whatever.
 
NQ vs ES

NQ almost approached the all time high but turned where it had turned before the larger drop, in the vicinity of 7008. On the weekly the previous trend channel's top is right above the 7008 area. It's an area I'd be keeping an eye on.

Comparing NQ to ES we can see that ES is not as strong as NQ. It has quite a bit of distance to go to reach its previous all time high, whereas NQ was much closer. Last trip around both ES and NQ were making new highs almost together. Something has changed and if ES doesn't show strength it would be another flag alerting us to not snooze around here. And also the DL break has occurred to show some potential change in stride.

TC top/Resistance/DL break/ES weakness = Something's afoot ... maybe.

Gringo
 

Attachments

  • NQ Weekly.png
    NQ Weekly.png
    55.6 KB · Views: 202
  • NQ Daily.png
    NQ Daily.png
    32.8 KB · Views: 199
  • ES Daily.png
    ES Daily.png
    38.2 KB · Views: 180
Last edited:
NQ Monthly

NQ is approaching interesting price levels. 7047.25 was the all time high and it's close at hand.
 
DL breach on Q.

I couldn't take advantage of this drop. A lot of action took place in the after hours and when the open came (QQQ) price wasn't at an optimal location from my price risk perspective. Maybe those who trade the futures had a better entry. Now I am a bit more cautious and slower to engage the market, yet this was an example IMO of the advantage of trading the futures.

Gringo

According to the SLA, the entry was below the low of the 20th, triggered the afternoon of the 21st. This represented a risk of 65pts in the futures contract vs less than two in the Q (using the minimums in each). You may have modified the SLA to entail a greater risk in futures than in the ETF, but, as written, the entries are the same.
 
According to the SLA, the entry was below the low of the 20th, triggered the afternoon of the 21st. This represented a risk of 65pts in the futures contract vs less than two in the Q (using the minimums in each). You may have modified the SLA to entail a greater risk in futures than in the ETF, but, as written, the entries are the same.

I had a tighter DL leading to 21st becoming a bit late for my purposes.
 
I had a tighter DL leading to 21st becoming a bit late for my purposes.

A "tighter DL" means trading intraday, and that's a different ball of wax. To gain the most from this, I suggest you apply it as written. Otherwise you risk missing the trade entirely.
 
A "tighter DL" means trading intraday, and that's a different ball of wax. To gain the most from this, I suggest you apply it as written. Otherwise you risk missing the trade entirely.

Hello DBP, what are your thoughts on this SLA entry in BTC?

attachment.php


Happy easter!
 

Attachments

  • btc sla.png
    btc sla.png
    43.2 KB · Views: 822
what about the bigger picture goto? (i have no interest in trading btc btw)


I charted the bigger picture on the longer time frame chart on the left, price appears to be finding support at the long term blue line.

Additionally, the 50% retracement of the most upwave is 10,000 USD so whether price finds support here or tanks is significant regarding the probability of a further upwave.

ok my mistake, i thought your left chart was a shorter time frame. I see what you mean about the 50% but I thought the wedge shape I drew was also significant here?
 
Top