You are using an out of date browser. It may not display this or other websites correctly.
You should upgrade or use an alternative browser.
You should upgrade or use an alternative browser.
mpups
Experienced member
- Messages
- 1,022
- Likes
- 144
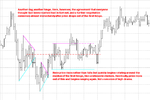
The last good one in the NQ daily was formed during the last half of August. The median was tested on 9/25.
oh yeah thanks ill see if i can spot any more of these around 🙂 this must have been a puzzling one to latch onto the way the big break/outside bar formed from a gap down
dbphoenix
Guest Author
- Messages
- 6,954
- Likes
- 1,266
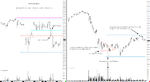
Avoid forcing the two lines into a triangle shape. The hinge is not a triangle; it is merely two sloping lines, one of which tracks lower highs and the other of which tracks higher lows. These two lines may suggest a triangle, and in a mean-reverting instrument such as the NQ, they may even be of relatively equal length which will eventually end in an apex that is equivalent to a mean. However, the suggestion of a triangle is all that this amounts to. Forcing the hinge into an isosceles shape will likely provide the wrong information and result in a failing trade. Since you changed the angle of your lower line, this hinge provides the wrong information, particularly with regard to support and resistance. Since the hinge as properly drawn is for all intents and purposes a mess, price goes pretty much nowhere, at least during the period of time illustrated in this chart: you end up in more or less the same place as you started. Avoiding making something out of nothing can prevent you from making low-probability trades.
Last edited:
Kleft
Member
- Messages
- 56
- Likes
- 29
Was this done in real time or hindsight?
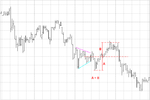
Saw it develop in real time, hinge formed, then a selling climax breakdown, a return to the apex where I noted an equidistant move up into Fridays lows, price then failed to make much progress before retesting the climax low then moving higher. This was happening at a point where there were a few things happening on a higher time frame.
Edit: Chopped in changed with regards to the lower line of the hinge, first two lows close to a DB, looked at the latter two lows as it developed further which gives same apex. Its not perfect but I was trying to focus on the behaviour and what could happen next.
Last edited:
dbphoenix
Guest Author
- Messages
- 6,954
- Likes
- 1,266
Saw it develop in real time, hinge formed, then a selling climax breakdown, a return to the apex where I noted an equidistant move up into Fridays lows, price then failed to make much progress before retesting the climax low then moving higher. This was happening at a point where there were a few things happening on a higher time frame.
I suggest you look at my edited post above. Most of what you have here can't be determined by the chart you've posted.
dbphoenix
Guest Author
- Messages
- 6,954
- Likes
- 1,266
Edit: Chopped in changed with regards to the lower line of the hinge, first two lows close to a DB, looked at the latter two lows as it developed further which gives same apex. Its not perfect but I was trying to focus on the behaviour and what could happen next.
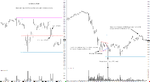
The purpose of a hinge is to renegotiate value. There may be some such renegotiation going on here, but uncontrolled, hence the sloppiness of the hinge, or what appears to be a hinge. Given where it occurs during the day, it is more likely just a consolidation and reassessment, a rest while traders decide what they're going to do next. In fact, traders spend the next six hours deciding what they're going to do next. Therefore, what appears to be a hinge isn't, which means that there's no "equidistant move up into Friday's lows" since the apex is lower than charted.
This is not to say that there's no trade here, but the trade stems from the volume climax, the selling climax, and the test, which have just recently been covered here. In terms of drawing money from this, the "hinge" -- or consolidation -- is irrelevant.
Kleft
Member
- Messages
- 56
- Likes
- 29
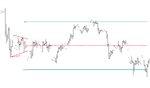
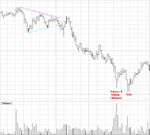
I'm not tick perfect by any means and my lines were a little scrappy, I've cleaned it up a little to be more exact with what I imagined, still open to dissection though.
Edit: If this is only "what appears to be a hinge" is it chop/indecision? what happens next (the climax) is unknowable at that moment in time so one might have a strategy for a hinge, does the selling climax negate the "hinge"?
Edit: If this is only "what appears to be a hinge" is it chop/indecision? what happens next (the climax) is unknowable at that moment in time so one might have a strategy for a hinge, does the selling climax negate the "hinge"?
Attachments
Last edited:
dbphoenix
Guest Author
- Messages
- 6,954
- Likes
- 1,266
I'm not tick perfect by any means and my lines were a little scrappy, I've cleaned it up a little to be more exact with what I imagined, still open to dissection though.
Edit: If this is only "what appears to be a hinge" is it chop/indecision? what happens next (the climax) is unknowable at that moment in time so one might have a strategy for it, does the selling climax negate the "hinge"?
As I said, given where it occurs during the day, it is more likely just a consolidation and reassessment, a rest while traders decide what they're going to do next. As to your lines, I've suggested more than once that you abandon them as more often than not they draw you into blind alleys. Whatever importance they appear to have is in your imagination (the word "imagine" should not spring to mind in any form; what matters most is what is there, visible to anyone who looks at it).
As to the MPs (midpoints), they have no importance either. The midpoint is merely a means by which Wyckoff judged potential strength and weakness (and it didn't always pan out). It does not provide support or resistance and has no particular meaning otherwise. In any case, what happened last week is not pertinent. What is pertinent to this particular trade are the volume climax, the selling climax, and the test.
I've posted a chart with the correct hinge, such as it is. I've also extended the upper and lower slopes to what would have been the apex if price hadn't already left it. The upward poke out of it does suggest insufficient buying interest, but there's no need to make too much of it, if anything, because there's no trade here. The trade is in the climactic action previously mentioned.
Keep it simple.
Attachments
mpups
Experienced member
- Messages
- 1,022
- Likes
- 144
:cheesy:.., hence the sloppiness of the hinge, or what appears to be a hinge...
hi db 🙂
i just wondered as what are your thoughts on candlesticks and why you prefer simple black ohlc bars? do you find the different colored bodies and thin wicks a distraction? i think thats why i stopped using them and also use ohlc.
do you want to pay less attention to whether its an up or down bar by keeping them all black?
Last edited:
dbphoenix
Guest Author
- Messages
- 6,954
- Likes
- 1,266
:cheesy:
hi db 🙂
i just wondered as what are your thoughts on candlesticks and why you prefer simple black ohlc bars? do you find the different colored bodies and thin wicks a distraction? i think thats why i stopped using them and also use ohlc.
do you want to pay less attention to whether its an up or down bar by keeping them all black?
Difficult to give a short answer to that. When they came out twenty+ years ago, it seemed to me that they could be very useful when scanning or skimming (back then I was trading stocks). And to some extent they were. But the candles were so often wrong in relation to the previous candles in terms of whether the body was solid or not. So I wound up having to inspect the body anyway to determine whether or not it really was supposed to be solid (or whatever) or not. So the time saved was negligible. And when color came along, it was even worse.
Then there were the patterns, which started out as a relative handful and now number in the hundreds, but eventually it was determined that the usefulness of the patterns in terms of predictability was statistically null. And for intraday they're useless as there are no closes intraday.
So I use bars. But even there I don't pay much attention to the bar as I'm watching price live and the bar is just there, like furniture. I'm watching the "dot", which is a chief reason why explaining trading price with static charts is so difficult.
As far as to whether it is an "up" or "down" bar, I again don't pay much attention to the bar but rather the wave of which the bar is a part (see this post for a more detailed explanation). This makes little sense to most daytraders because they're either watching too many charts or they're working, so they're not really looking at the chart. All they see, therefore, is bars. Or candles. And they seek meaning in these bars (or candles). And there isn't any. They're just collections of price prints, nothing more.
Last edited:
dbphoenix
Guest Author
- Messages
- 6,954
- Likes
- 1,266
I don't quite know why this thread receives so many views unless it's a traffic-accident-type situation in which one just can't turn away. But given that it does receive a lot of views, and given Kleft's charts from yesterday, I want to clear up potential confusion before moving on.
The purpose of the two recent arcs pertaining to climaxes/tests and hinges is/was/has been to realign focus on the basic and the simple. Wyckoff's course in toto is over 500 pages long, but the bulk of that is example and explanation. If one reduces all of it to the most basic basics, he ends up with trending and ranging, the characteristics of each, and how one shifts from one to the other. Climaxes and tests are one means of accomplishing these shifts. Hinges are a form of ranging, as explained earlier. And if one understands nothing else but these two behavioral phenomena, he can make quite a lot of money. Yes, price can and often does turn without being dramatic about it, but trading such turns requires an equanimity that is unknown to most traders, particularly newcomers. The chief quality required to trade climaxes and hinges is patience, and if the trader has no patience, he may as well turn his attention to some other form of amusement.
What every trader looks for is trading opportunities, and Kleft illustrates a number of trading opportunities in his charts. But there are too many of them, and the more extraneous detail one includes, the more difficult the trading decision becomes. And the more difficult the decision, the more hesitation. And the more hesitation, the more opportunity for the trader to slip back into emotionalism. In my book, I address finding trading opportunities by beginning with the weekly and daily and looking for approaches to longer-term trend channels and to shorter-term ranges. When price nears the limits of these channels and ranges, a potential trading opportunity looms as these areas are most likely followed by The Money and are therefore the most likely to result in turning points. None of that, however, is pertinent to what is being presented here. It's too complicated. It's unnecessary. And it's impractical. For instance, the potential trading opportunities in Kleft's hourly chart lie in the approaches that price makes to the limits of his range. But even if one has decided to act on the approach and not wait to see if price actually gets to one of those limits, the reversals take place in the middle of the night. So the chart serves no purpose. Even if price were to reverse off one of the limits of Kleft's range during market hours, one would still have to wait for some sort of signal that the time is right to take the trade, the simplest of which are climaxes and hinges.
Make it simple. Then make it simpler. Then make it simpler still. Determine exactly what it is you need to look for (which is the point of these arcs on climaxes and hinges). Then focus all your attention on that. Don't get distracted by extraneous detail and irrelevant movements. Don't concern yourself with "Well, what about that over there? What about this over here?" Focus on these two basic phenomena. If the clouds don't lift, then breathe deeply, stop trading, and revert to observation, even if for only a few hours. And don't plot a single line on your charts.
mpups
Experienced member
- Messages
- 1,022
- Likes
- 144
Difficult to give a short answer to that. When they came out twenty+ years ago, it seemed to me that they could be very useful when scanning or skimming (back then I was trading stocks). And to some extent they were. But the candles were so often wrong in relation to the previous candles in terms of whether the body was solid or not. So I wound up having to inspect the body anyway to determine whether or not it really was supposed to be solid (or whatever) or not. So the time saved was negligible. And when color came along, it was even worse.
Then there were the patterns, which started out as a relative handful and now number in the hundreds, but eventually it was determined that the usefulness of the patterns in terms of predictability was statistically null. And for intraday they're useless as there are no closes intraday.
So I use bars. But even there I don't pay much attention to the bar as I'm watching price live and the bar is just there, like furniture. I'm watching the "dot", which is a chief reason why explaining trading price with static charts is so difficult.
As far as to whether it is an "up" or "down" bar, I again don't pay much attention to the bar but rather the wave of which the bar is a part (see this post for a more detailed explanation). This makes little sense to most daytraders because they're either watching too many charts or they're working, so they're not really looking at the chart. All they see, therefore, is bars. Or candles. And they seek meaning in these bars (or candles). And there isn't any. They're just collections of price prints, nothing more.
Thanks db its interesting to know, I appreciate it. I will check out your links later to understand what you mean more.
dbphoenix
Guest Author
- Messages
- 6,954
- Likes
- 1,266
Thanks db its interesting to know, I appreciate it. I will check out your links later to understand what you mean more.
If and when you do check them out, the following may be helpful. I wrote it nearly twenty years ago in order to help beginners understand that daily bars do not just spring forth whole; they are formed by the trades that take place during the day, and knowing how traders arrived at a closing price can be and often is crucial (the intraday "bar", on the other hand, is an invention of software engineers and has no particular meaning as there are no closes until the end of the session, or, in the case of futures, the end of the week; this will be of no importance to you if you don't trade intraday).
Whether you get anything out of bar or candlestick analysis may depend in large part on whether you are better at inductive or deductive reasoning. If I'm exploring something new, for example, I'll look for specific examples of whatever it is I'm investigating, then formulate preliminary hypotheses which are consistent with what I'm seeing. Then I'll apply those hypotheses to further examples in an attempt to come up with general principles. If those general principles hold over time, I'll ignore specific examples almost entirely unless I find one or several that seem to suggest that the general principle may have changed (or may not have been valid in the first place). Which is why I get very little out of the price bar/candlestick analyses provided by "experts" in books.
But whether one conducts his analysis via deductive or inductive reasoning, analyzing a given price bar/volume bar pair -- while interesting and even instructive -- is largely a waste of time in the larger scheme of things if one is trying to determine what it is he ought to be doing about whatever conclusions he arrived at. The reason for this is that a given bar is not anywhere near as important as the bars which follow it.
There is confusion, for example, regarding the significance or importance of high volume on a down bar. Is it a good thing? Or is it a bad thing? And the answer is that it depends. It depends on where the bar is, how long it is, where the open is on the bar, where the close is, the spread between the open and close, the distance between the close and the low, the distance between the open and the high, where support and resistance lie, what the market's doing, how strong the volume is and at what point the volume became strong etc, etc, and so on.
But even if one decides that the bar is a good thing, that decision can be no more than a preliminary hypothesis. The rubber meets the road in the bars that follow. Does volume increase or dry up? Does the price continue to fall or does it rebound? If support is being tested, does it hold? As with the beginner who asks whether a large trade is a buy order or a sell order, it doesn't really make any difference since one side of the trade can't exist without the other (otherwise it's just pending). What matters is the immediate effect on the stock. If it rises, the trade represented buying pressure. If it falls, it represented selling pressure. But it takes a few minutes to find that out. Is there enough demand to absorb that supply and propel the stock higher? Then hang on for dear life. Is there not enough demand to absorb that supply and propel the stock higher? Then get the hell out without hesitation and stand aside until you see where the decline tails off.
Even if you know the "meaning" of strong volume and a long bar (or weak volume and a long bar, or strong volume and a weak bar, or strong volume with a long bar in which the relationship of the open and close to the high and the low are . . .), you have to arrive at a set of general principles or else you'll never be able to act. And the ability to act decisively and with conviction is essential to maximizing profits. Understanding this can be a challenge even if one is unusually bright. With experience, that understanding will come if one applies himself enough. And there really is no way to understand it without experience. But the experience required to understand all this needn't take years. At the very least it can be accelerated by sitting down in front of a screen which contains a bar and volume chart (no indicators of any kind) and “replay” software. Set the speed fast enough so that you won’t feel as though you’re watching paint dry. As the daily bar forms, along with its volume bar, you can more easily develop a sensitivity not only to the struggle between bulls and bears but also the relative strength of each from trade to trade. Even a half-hour of doing this will lead to a great many Ah-Ha moments which are difficult if not impossible to reach by looking at static charts in hindsight.
mpups
Experienced member
- Messages
- 1,022
- Likes
- 144
If and when you do check them out, the following may be helpful. I wrote it nearly twenty years ago in order to help beginners understand that daily bars do not just spring forth whole; they are formed by the trades that take place during the day, and knowing how traders arrived at a closing price can be and often is crucial (the intraday "bar", on the other hand, is an invention of software engineers and has no particular meaning as there are no closes until the end of the session, or, in the case of futures, the end of the week; this will be of no importance to you if you don't trade intraday).
Whether you get anything out of bar or candlestick analysis may depend in large part on whether you are better at inductive or deductive reasoning. If I'm exploring something new, for example, I'll look for specific examples of whatever it is I'm investigating, then formulate preliminary hypotheses which are consistent with what I'm seeing. Then I'll apply those hypotheses to further examples in an attempt to come up with general principles. If those general principles hold over time, I'll ignore specific examples almost entirely unless I find one or several that seem to suggest that the general principle may have changed (or may not have been valid in the first place). Which is why I get very little out of the price bar/candlestick analyses provided by "experts" in books.
But whether one conducts his analysis via deductive or inductive reasoning, analyzing a given price bar/volume bar pair -- while interesting and even instructive -- is largely a waste of time in the larger scheme of things if one is trying to determine what it is he ought to be doing about whatever conclusions he arrived at. The reason for this is that a given bar is not anywhere near as important as the bars which follow it.
There is confusion, for example, regarding the significance or importance of high volume on a down bar. Is it a good thing? Or is it a bad thing? And the answer is that it depends. It depends on where the bar is, how long it is, where the open is on the bar, where the close is, the spread between the open and close, the distance between the close and the low, the distance between the open and the high, where support and resistance lie, what the market's doing, how strong the volume is and at what point the volume became strong etc, etc, and so on.
But even if one decides that the bar is a good thing, that decision can be no more than a preliminary hypothesis. The rubber meets the road in the bars that follow. Does volume increase or dry up? Does the price continue to fall or does it rebound? If support is being tested, does it hold? As with the beginner who asks whether a large trade is a buy order or a sell order, it doesn't really make any difference since one side of the trade can't exist without the other (otherwise it's just pending). What matters is the immediate effect on the stock. If it rises, the trade represented buying pressure. If it falls, it represented selling pressure. But it takes a few minutes to find that out. Is there enough demand to absorb that supply and propel the stock higher? Then hang on for dear life. Is there not enough demand to absorb that supply and propel the stock higher? Then get the hell out without hesitation and stand aside until you see where the decline tails off.
Even if you know the "meaning" of strong volume and a long bar (or weak volume and a long bar, or strong volume and a weak bar, or strong volume with a long bar in which the relationship of the open and close to the high and the low are . . .), you have to arrive at a set of general principles or else you'll never be able to act. And the ability to act decisively and with conviction is essential to maximizing profits. Understanding this can be a challenge even if one is unusually bright. With experience, that understanding will come if one applies himself enough. And there really is no way to understand it without experience. But the experience required to understand all this needn't take years. At the very least it can be accelerated by sitting down in front of a screen which contains a bar and volume chart (no indicators of any kind) and “replay” software. Set the speed fast enough so that you won’t feel as though you’re watching paint dry. As the daily bar forms, along with its volume bar, you can more easily develop a sensitivity not only to the struggle between bulls and bears but also the relative strength of each from trade to trade. Even a half-hour of doing this will lead to a great many Ah-Ha moments which are difficult if not impossible to reach by looking at static charts in hindsight.
This is fantastic stuff db 😎 ill be thinking about it and searching for answers :idea:
Similar threads
- Replies
- 0
- Views
- 2K