The New Tick Set Up
First of all, let me give you the set up.
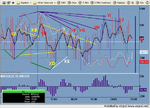
5 minute Tick chart
2 minute VWMA OHLC
Overlays
ES, white line OHLC
SOX, red line OHLC
China, you may disagree with these beta being used. Lets see if you agree with where I am going with this. We can talk about this on messenger. If anyone else, wants to discuss this, we could organise an online meeting.
What are we trying to do here. Make money and not draw pretty charts. How do we want to do it. Buy low, sell high, sell high, buy low. In an up trend, we are buying the dips and scalping the tops if we are nimble enough and have the right equipment and plan. In down trend we are selling the lower highs and again scalp if we can. How about consolidations. We are told assume that they will break in the direction of the present trend. Does this always happen. No. So what do we need. First of all to understand the set ups on the ES such as chart patterns and secondly, some sort of filter that will stop us getting Roger Moored.
To the action.
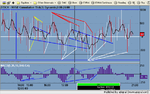
XA
The ES gapped down so we expect that it will attempt to fill this gap. We are now looking for a HL ES long entry. On the Tick, ES is above the SOX which is above the 2 minute VWMA and we are hugging the zero line.. I would have preferred that the SOX would be above the ES. This tells me that we I will try a long but the up side may be limited. The trigger is the break of the Tick bar above the ES line.
XB
Similar set up again on ES. This time, the SOX is above the ES which is above the VWMA. The long trigger is the penetration of the Tick bar above the SOX or the ES. This depends how aggressive you are. The text book entry on the ES corresponds to the the Tick/ES break. One more thing to mention is that between XA and XB,we have HLs in and the SOX made HH.
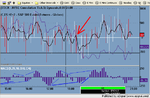
YC
On the ES, the pivot was broken but did not hold as support. Straight away, we have alarm bells going off. What is our Tick chart doing. A question for Sand here, The ES is above the VWMA and the SOX is beneath them all. Would you call this a weak futures move as per the Prem. The way I see it, the SOX was weak and it dragged the ES down.
XD
A HL in the ES. Do we go long. I suppose we do. Would it be a strong move and a possible an other attempt at the pivot that would at least make a double top. Back to the Tick. VWMA below zero, SOX above ES. We did have a rising Tick but no confirmation in MACD. A long with an exit at the first sign of negativity. Knowing what I know now, yes.
?
Is this a right shoulder short. I thought so. It was a bit hasty. The SOX was by now beneath the ES but the VWMA is above zero. It did not work. Why not. I suppose it just didn't. We are playing the odds. Skim, what do ou think of this move.
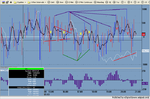
XE
Are we going long here. HL ES, rising Tick but look at the SOX beneath the ES and VWMA zero. The MACD looks ****e too. Thanks but no thanks.
YF
LHs and LLs across the board on Tick chart and SOX was looking very ill. This is our right shoulder.
YG
ES makes LH and look at the SOX, ES VWMA set up. Add shorts.
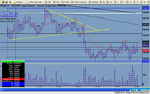
YH,
VWMA is making HLS. The Tick is rising and the MACD is looking positive. Are you buying the bottom. Look at the position on ES and SOX, especially the SOX on the Tick chart. Here we are selling tops near resistance. One thing I did not mention. Have you noticed how I have positioned the spokes on the red bars. It is when the Tick breaks beneath the VWMA we short.
YI
YI man. Sorry, I had to say that. Same short method.
YJ
This is the best short. Why, we are shorting at Thursdays low.
In summation we have, Chinas MACD Tick method. We support and Resistance on the VWMA. We have relative strength and beta set ups and finally we a reverse ES, Tick divergence.
I hope all this makes sense.
Andy
Correction, there is a yellow line at the bottom. Not sure why I put it there.