Trading the ES (E mini) December 2003

stoploss - LOL

Q - sorry m8, hope u dont mind me calling u Q? Even tho I shud be fluent with Latin as I speak Castellano, I am terrible with spelling Roman Empire names? whez the name from btw? Was it that famous Roman Legionaire who built the wall to fight back the Scots?

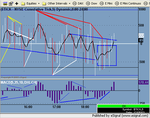
as for 13:00, neg divs across indices too strong imo for any meaningful rally. I'd be looking to sell UP again if I get a chance.
 
China, I used to deal in antiques in a former life back in the UK, specialising in early oak furniture. That's enough info for a man who likes puzzles. I do, however like the Q version - reminds me of the boffin gadget man in Bond films!
Cheers
Q
 
going into 14;15 time pivot

cud be a L at 14;15. Potentially. Neg divs across indices still too strong tho.

this is how I c the day so far. Trades per system r dark green lines. Apart from the red line which was not a proper tick pos div as ES did not make a LL, but given Tick being stubbornly >0, reasonable reverse to L.

Pink lines - per Mark_m's suggestions. Still trying to figure out how to use them best. U can probably c thez quite a bit of important info in it.

Blue lines - where u cud take a L scalp for 1.5 pts. Obviously just a scalp, given no proper tick div sequence, neg divs across indices and no macd of cash on high-beta indices pos divs.
 

Attachments

  • tick0512.jpg
    tick0512.jpg
    32.7 KB · Views: 304
Um

SOX and BIX looking +. The action in this box looked positive.
 

Attachments

  • dow 5min175.png
    dow 5min175.png
    70.8 KB · Views: 296
out of L @ 61.50 for 1.75 pts scalp. neg divs across indices r too strong imo.

finished for the week. will post report later. good w/e to all geezers. :)
 
Stoploss,

Sorry I haven't contributed much this week ;). You TICK analysis seems to be coming along great.

I've been trying to get to grips with this monster that you use and seeing if I can replace my old software with EFS scripts. Jury is still out on that one.

However did you know you could do this with 7.5 ?

- Coloured bars are ES
- Grey bars are TICK
- Thick blue is TICK 0
- Thick RED/GREEN are YD ES high/low
- White lines are TICK 1st hour pivot.

Now if only I could get a macd of TICK up on this I'd be up and away.
 

Attachments

  • tick 5m chart.gif
    tick 5m chart.gif
    30.1 KB · Views: 316
hi sandpiper can you expain how the above is used and what does YD mean - sorry to sound so obvious

thanks anmolway
 
anmolway,

YD means yesterday. Sorry about that, just being lazy.

I'm trying to incorperate a system/method that China White and Stoploss have been working on/discussing into my workspace. The problem is that I am so used to watching cetain other things that I find it almost impossible to watch/take in another screen.

With that in mind I've simply been trying to overlay the TICK symbol with it's corresponding macd on top of the ES chart.

Also, rather than viewing disconnected TICK/ES charts, viewing them together establishes beyond doubt that ES mirrors TICK/TICK mirrors ES (whichever way you want to look at it) right down to 5 minute bar patterns, i.e. ohlc.

So, the key then (and I'm sure China could/and has explained this much better than I) is to try and pick up on divergences
between TICK and ES in terms of strength/weakness, i.e. does the movement in TICK (cash market) suggest weakness or strength when compared with the movement of the futures over the same period of time.

One example of this above is where TICK makes a higher high but ES makes a lower high (think this is one of mark-m's).

The zero TICK line is for reference (used with the grey bars). China has mentioned it a few times as have I. Have a root round the thread and if you can't find it I'm sure someone will explain it's possible merits.
 
Delboy Trotter trades again

ok lads/lasses - a complete and utter p1ss at meself :cry:

All 3 snapshots - at 10:30, 13:00 and 14:15 - display naz down more than 1%, with internals negative at 2:1 or more - TREND DOWN DAY. What does the system say on a trend down day? Short UP (if it gets there as it did TWICE today!!!), short LP or 40 ema/5min. Tick is a secondary indicator on a trend day and ANY Long from tick pos divs is a scalp.

The day offered up to 16 pts!!! Look at the chart. All blue lines r Long scalps which shud've bn faded at 40 ema/5min.

Only 5.5 pts in the bag - and a complete misinterpretation of the system. Good lesson.

Very nice w/e to all u lot
 

Attachments

  • tick0512.jpg
    tick0512.jpg
    33.3 KB · Views: 250
Rev Divs Today

only 5.5 points ? Your loosing your touch mate :cheesy:

I didn't trade today but a look at the chart shows several nice reverse divs between ES and the TICK - all good for a point or 2.

Interestingly 1100, 1320 and 1500 all had divergence on MACD too:
 

Attachments

  • tick0512.gif
    tick0512.gif
    20.2 KB · Views: 231
China,

5.5 is considerably better than a poke in the eye with a short stick m8. You can't catch 'em all they say, however, it is extremely interesting and informative watching you have a damn good try ;).

Instead of slapping yourself with the wet fish, pat yourself on the back for a job well done. ;)

Anyway, have a good w/e and thanks for the continued explanations. :).
 
Sand

How did you do that thing with the charts.

The method is coming along. I will post later on. working on a few ideas.
 
Stoploss,

When you enter your symbol on an advanced chart you can now add additional symbols. So, I entered ES Z3 and then added additional symbol $TICK. You then add a scale for tick on the left of the chart.

The main symbol overlays the additional one. Only thing I can't work out is how to add macd of $TICK to this, i.e. you can add macd of ES easy enough, but I want TICK as well.

You can also add studies such as macd to the price window in 7.5.
 
Right lads

I have been thinking a bit. As you all know, the tick can never totally represent what is happening to the cash because as each tick for every equity should not carry the same weight.

At present, we are looking for Tick divergence against the ES. ie, in a down trend, the tick diverges positively against the ES.

However, what is happening if the tick is making successive LHs but the ES is not following. In this case, I believe what is happening is low cap stocks which are tanking, are dragging down the tick but the ES, which in effect is the accumulated value of all equities is showing the true value. Therefore, we now have a positive divergence of the ES against the tick.

Is this making sense.
Cheers
Andy
 
Andy,

Yes. Makes a lot of sense. If it were the large cap stocks showing weakness then the ES (S&P) would be making lower highs as well I would have thought.

As China says, it's kind of a weakness with the use of TICK. Although in many ways it's what makes the trades based on divergences work (as you've identified there).

Ideally (as he has said) you would have a TICK for the S&P 500, a TICK for the OEX, i.e. the S&P 100 and then a TICK for maybe the top 20% cap wise. Certainly a TRIN refined to this degree would be much more useful than the NYSE version (imho).

I did think about looking at that Rydex equally weighted S&P 500 ETF once and comparing it to the cap weighted S&P 500 to see if there was any insights to be gained from watching it. Just never got round to it.

I have tried in the past to create an S&P 500 TICK and OEX TICK but the quality of the equity data I received was so poor that it compromised the validity of any results.

It's something I might have a look at again over Christmas, now I've switched to a decent vendor.
 
Andy,

Yes. You would have to do it in efs though, i.e it's not available as a standard feature.

If you have a look in the shared libraries there are a couple of custom functions that highlight TICK and TIKI extremes that can be included on an ES chart. So, your divergences would just be an extension of that.
 
Alright lads

after a cupl of Cuba Libres and your kind remarks I start feeling better :)

This msg is a bit off-topic. But let me explain how I evaluate effectiveness of any trading system.

I am strongly against bencmarking the trading system (or a trader) against SPX. What loads of ppl try to do is to "beat" SPX. Let me explain why I reckon this is a pile of rub****h. 2 absurd examples:

1) u have a +10/-10 trend reversal day and SPX finishes flat. A trader is up 4 teenies. He beat SPX alright, but wud u call that a good trading day?

2) SPX gaps down 10 pts at the open and closes another 10 pts down. Our trader is up 9 pts. Unless he stayed short overnight, thez no way he cud beat SPX. Excellent trading.

Hence, "beating" SPX daily is truly a distraction.

Now about "beating" trends. If u bot SPX on March 12 and did NADA, u'd be up ruffly 280 pts over about 180 sessions by now, that is 1.5 pts per day. Is it a good result for a daytrader? Not too hard to "beat" innit? :)

Now how I evaluate a trading system.

At front end volatility of ruffly 17% (annualised), DAILY VOLATILITY is 17/sqrt(252) = 1.1% = ruffly 12 SP points/day. I personally think a trading system/trader shines if half of that is in the bag daily. 12/2 = 6, ok 5 pts a day = 25 pts a week. Above 8 pts/day = 40 pts/week is the system u shud be marrying! :)

However, as we know not all days r juicy. So on a day when discipline in following the system wud rake in 15+ pts, closing with a third of that is quite pathetic trading. Just coz on some other days 5 pts is all there is on the plate.....

anyway hv a good w/e. Good week overall.
 
Top