Trading the ES (E mini) December 2003

mate the pink is 5 ema/1 hr, green - 20 ema/1hr = 240/5min, the other two r cock-ups, don't look at them :)
 
big pic (daily)

this is S&P's daily chart. quite amazing how inside Andrew's Pitchfork defines the upward channel support. Also shows that technically thez plenty of room to the upside within the current pattern, that is without any "dramatic" B/Os :)
 

Attachments

  • s&pdaily.jpg
    s&pdaily.jpg
    64.4 KB · Views: 320
what exactly is Santa rally?

let us remind ourselves - according to reuters Santa rally starts on the day b4 Xmas (24th) and usually covers 7 trading sessions. quote: "proverbial "Santa Claus" rally... has lifted the S&P 500 by an average of 1.7% in the last 5 days of December and the first two days of January since 1969". end of quote :cheesy:
 
Combining the black art with MACD

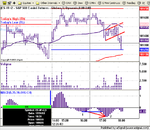
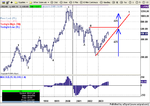
The below chart shows a bear flag consolidation that was formed beneath the previous days high. The idea here is to place a stop above the highest bar in the consolidation and short it at the break of the bottom channel.

Now trading Dark Side requires price and volume together with horizontal S&R, fib and simple Elliot Wave.

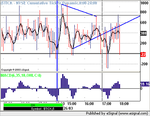
I have been watching how the MACD behaves when we have consolidations. What interests me here is the LL of MACD number 2. Also, if you look at the horizontal blue line, you can see that by the fourth down bar in MACD 2 that we had already surpassed the low of MACD 1. This indicated to me that the move down was a strong one. If you combine this with the Dark Side, you get a nice heads up that you should be looking for a shorting opportunity.

I am not saying that you should base your entries from MACD but as a visual representation, it is very easy to read and can be used to give you some courage and self belief when entering a trade base on Black Art triggers.
 

Attachments

  • dow 5min211.png
    dow 5min211.png
    87.3 KB · Views: 227
of coz mate - if u get a LL on ANY indicator (Macd included) - that means there is NO pos divergence, which in ANY divergence-based method means only 1 thing - more downside to come! :)

happy and profitable NY to u lot!
 
Calling wavers

Got a monthly chart of the SOX here. This to me looks like a simple EW pattern
 

Attachments

  • dow 5min214.png
    dow 5min214.png
    62.6 KB · Views: 235
Projection

Never did understand EW but this is I what am projecting for the next 1 leg up.
 

Attachments

  • dow 5min215.png
    dow 5min215.png
    65.5 KB · Views: 246
good example of how arbitrary EW are. matey what if the present level is 1 in the new 1-5 series up and what is coming is leg 2 down to say 300? wud be perfectly fine with the waves labelling but do u understand what SOX going down to 300 mean for broader indices? :)
 
m8, there not door numbers. If the SOX was to hit 300, all the other indecis will be affected. To what extent, I do not know as they do not always move in gear. What would be nice is to ride the up and down waves but evey one would like to do that.
 
Board Name

Has anybody previously asked for the name of this board to be changed to "Trading the E-mini", to save moving threads when the underlying changes?.

Rgds
 
hillbillie:

The thread title just changes monthly because with all the charts posted, it gets to be one huge thread. So to make it more manageable, we have a new thread each month which reflects that - it's not the underlying which changes. :D
 
The SOX is the Semi Conductor index. It's a good to watch as a leading indicator.

The RSI 14 is based on half a luna cycle of 28 days/periods and the MACD 5/35/10 is used by China. I have tried other settings vut this one seems to work.
 
You find that the larger the period the fewer the divergences. I experimented with a 84 period and it worked well as a trend following tool but the TICK beats in hands down.
 
Livermore - I wudnt be able to mathematically explain why 5,35,10 works so well on 5 min :) I'd say it's a purely empirical finding which i am most comfortable with.

the funny thing is that this setting seems to be best - imo of coz - on all time frames! i'd speculate :) that on 1 min it's got something to do with 34 and 9 min MAs which again many traders find the easiest to work with.
 
Top