You are using an out of date browser. It may not display this or other websites correctly.
You should upgrade or use an alternative browser.
You should upgrade or use an alternative browser.
Trading the ES (E mini) December 2003
- Thread starter stoploss please
- Start date
- Watchers 7
china white
Established member
- Messages
- 979
- Likes
- 12
u've got settings in reverse mate 12,26,9 i believe is the standard one, not 26,12,9
stoploss please
Established member
- Messages
- 780
- Likes
- 10
Livermore
It moves like any other indecis but you can use it to give you an idea of possible direction in the broader market. For instance, the DOW makes HHs but the SOX, RUS2000, and the Compq makes a double top, the uptrend in the DOW may be running out of steam and the warning was given by the other indecis.
China is the man on how you use these filters.
hillbillie
Junior member
- Messages
- 29
- Likes
- 0
I beg to differ
The underlying never changes it is the E-MINI not the month which interests those who trade it on this board
As far as manageable I don't know,check CS after a few thousand posts, but as far as those of us who are interested in this tradeable entity are concerned it is one contract regardless of the quarter we may be trading(i.e. March or July etc).
Those on this board that are trading another contract in advance of the current contract , can simply post that fact in our comments and / or graphs for better readability of the contract traded.(After saying which, do note however, that all of the board so far have only posted the current contract and not the others)
Which is what we on the board are talking about, surely anyone who whishes to see last weeks comments and graphs can just go back a few posts, those that are in touch with this thread are already up to date 'cos we read it. Others can click on the last button to find the latest comments or the first page to see if they like it.
Or is this some sort of archiving issue?(i.e. delete past months posts or such?).If I have to look back to a post on PREM I have to back a couple of months(where the hell is it?)
I guess in the end I'd rather see a single pertinent thread to something I trade and not have to change every month for a very ambiguous reason.
Reason be damned
Hill
Skimbleshanks said:hillbillie:
The thread title just changes monthly because with all the charts posted, it gets to be one huge thread. So to make it more manageable, we have a new thread each month which reflects that - it's not the underlying which changes. 😀
The underlying never changes it is the E-MINI not the month which interests those who trade it on this board
As far as manageable I don't know,check CS after a few thousand posts, but as far as those of us who are interested in this tradeable entity are concerned it is one contract regardless of the quarter we may be trading(i.e. March or July etc).
Those on this board that are trading another contract in advance of the current contract , can simply post that fact in our comments and / or graphs for better readability of the contract traded.(After saying which, do note however, that all of the board so far have only posted the current contract and not the others)
Which is what we on the board are talking about, surely anyone who whishes to see last weeks comments and graphs can just go back a few posts, those that are in touch with this thread are already up to date 'cos we read it. Others can click on the last button to find the latest comments or the first page to see if they like it.
Or is this some sort of archiving issue?(i.e. delete past months posts or such?).If I have to look back to a post on PREM I have to back a couple of months(where the hell is it?)
I guess in the end I'd rather see a single pertinent thread to something I trade and not have to change every month for a very ambiguous reason.
Reason be damned
Hill
hillbillie
Junior member
- Messages
- 29
- Likes
- 0
thxs
China seems a pretty poor answer to me , but see my reply, lets get down to basics m8. This is what we trade lets get on with it and no fussin.
Hill
china white said:HB - i dont think any1 ever has! makes good sense.
China seems a pretty poor answer to me , but see my reply, lets get down to basics m8. This is what we trade lets get on with it and no fussin.
Hill
hillbillie
Junior member
- Messages
- 29
- Likes
- 0
China / stoploss et al
Well go on then say it!
As you're both the ringleaders go strut yur stuff!
BTW ever read 'scamman' on CS, not bad calls , lets see R3 put /call ratio on Tuesday play out.
Watch the MACD N/C.
Hill
china white said:HB - i dont think any1 ever has! makes good sense.
Well go on then say it!
As you're both the ringleaders go strut yur stuff!
BTW ever read 'scamman' on CS, not bad calls , lets see R3 put /call ratio on Tuesday play out.
Watch the MACD N/C.
Hill
stoploss please
Established member
- Messages
- 780
- Likes
- 10
Ringleader. Not me m8. I just ask the questions. I wish more of you would do the same.
china white
Established member
- Messages
- 979
- Likes
- 12
lads/lasses
i can c HB's point. E.g. if u take Chartman's brilliant analysis on the Dow, it's not the DJIA that ppl trade, but YM rather - which has the same issue of being rolled over btwn the contracts.
On the other hand, CM splits his posts by weeks not even months - just to make it easier to read and concentrate on whats going off in any particular week.
I am fine either way. Personally I do trade S&P500 index with whatever instrument is most liquid on it. We can just have one thread called "Trading Spooz" with ppl clearly stating what future they trade, or multiple (monthly or even weekly) threads.
IMO this is by far not the biggest problem in trading Spooz 🙂. Just let me know what u lot r leaning toward and I'll be very specific in my posts as to what I trade.
stoploss please
Established member
- Messages
- 780
- Likes
- 10
I do not think it actually matters what we call it or it what time segments it is saved as therefore I am happy to go with what ever is decided.
The way I use this thread is to encourage other traders to share their ideas and to create a lively debate which we can all benefit from. I do think this thread has begun to lack some direction and that we need fresh impetus to get it moving again. I really want us to look at another area of trading methodology that can be applied to the ES/S&P500.
How about we look at market timing and how it can be used with trading the dark side. We can still run a daily Tick analysis if you like.
china white
Established member
- Messages
- 979
- Likes
- 12
Stoploss - good u brot it up mate! 🙂
U may hv noticed 🙂 i am not posting that many tick-based charts these days. It's not just coz I turned into a "flojeroso" (lazy bastid) in mexico 🙂 but for an important reason rather.
I think any1 trading on Tick shud be aware of this.
We all know that ANY measurement of the market works better the more liquid the mrkt is. With Tick this effect is even stronger, since Tick is CASH market buy/sell intensity.
Let me give u an example. We r in a very thin mrkt. Futs pretty much live their own life 🙂 At moment T someone squares up one's short position (b4 New Year) in the last ten smallest stocks of S&P500 and we get tick at +10. At moment T+15 min another geezer squares up his short exposure in top 3 stocks - Tick = +3. If futures at T+15 happen to be higher than at T - our Tick analysis will pick it up as a negative div and a short signal. However, in such an illiquid mrkt it's no signal whatsoever, quite frankly if I had to trade it, I'd go with the direction of top cap stocks! 🙂
it is an absurd example. but it shows how difficult interpreting Tick in illiquid mrkt can be.
Modified Tick will sort out the latter problem and will be much more robust in light markets. However, the CASH - FUTS dichotomy will always sit there.
Hi China - hope you had good xmas mate - funny you mention Tick in a thin market. I noticed since 22Dec tick divs (and reverse divs) not delivering so reliably and thought it best to stay out.
Now, this Modified Tick - what's the difference if you don't mind me asking? When will it be available ?
Sounds interesting ...
Now, this Modified Tick - what's the difference if you don't mind me asking? When will it be available ?
Sounds interesting ...
china white
Established member
- Messages
- 979
- Likes
- 12
mate very much so, and I am very keen to have it developed and properly tested - up until then it is just an idea that really needs LOADS of research. I'd be very careful speculating on how this instrument is gonna behave. I am sorry - but I really can't be any more specific at this time 🙂
hillbillie
Junior member
- Messages
- 29
- Likes
- 0
Modified TICK
The only tools I know are at wealthlabs, I'll have ago in the new year.
My first approach will be to generate a tick of the top % players on net volume averaged over previous 5 days trading as I believe these move the spoos(like people who only watch MMM or MER etc, but am welcome to any ideas for modification.
N.B. this will take some time!
cheers
china white said:mate very much so, and I am very keen to have it developed and properly tested - up until then it is just an idea that really needs LOADS of research. I'd be very careful speculating on how this instrument is gonna behave. I am sorry - but I really can't be any more specific at this time 🙂
The only tools I know are at wealthlabs, I'll have ago in the new year.
My first approach will be to generate a tick of the top % players on net volume averaged over previous 5 days trading as I believe these move the spoos(like people who only watch MMM or MER etc, but am welcome to any ideas for modification.
N.B. this will take some time!
cheers
stoploss please
Established member
- Messages
- 780
- Likes
- 10
stoploss please
Established member
- Messages
- 780
- Likes
- 10
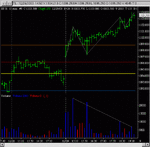
Market timings 29/12
A lot of you probably already know this so this is just for the newbees who do not watch for reversal times.
Phase 1.
9.30 to 11.15.
Phase 2.
11.15 to 14.15 (the doldrums).
Phase 3
14.15 to 16.00.
Reversal times.
Phase 1.
9.35, 10.00, 10.30, 11.15.
Phase 2.
12.00 and 13.30.
Phase 3.
14.30, 15.00 and 15.30.
Todays action.
(a). Top put in at 10EST.
(b). Reversal to short at 10.30EST
(c). Positive continuation at 11EST. I was looking for a signal at 11.15EST. Low put in at previous days high and todays open/low.
(d). Next move at 15.00EST.
One more thing of note. The ES was above its MA all day.
Attachments
Similar threads
- Replies
- 3
- Views
- 4K