Trading ES (Q2 2004)

Do people find this thread useful?

  • waste of typing time. pls trade your ideas in silence :(

    Votes: 0 0.0%

  • Total voters
    34
China

Thanks for your informative posts. I only had a short time to trade last night and unfortunately I traded point F. I knew it was weakening and should have got out earlier or should have reversed, but I didn't and took a 1.5 loss.

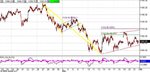
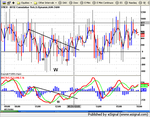
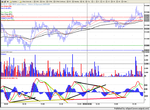
Anyway a question if I may. When you draw your entry lines, when do you actually enter? For example the Short at point E (thick red line), is at the point when it first breaks or is it at the retracement back to the line.

Cheers

Lard
 
china white said:
[...a trending market...]

... is when u have trend ratios btwn crosses (comp/dow and ndx/spx as primary and sox/comp and xbd/spx as secondary) at a particular time pivot, obviously the first one of 10:30 being the starting point for this whole trend definition

CW - I tried working backwards through that to see if I could understand it any better. No luck.

Any chance you could take that phrase by phrase for dimwits like wot I is mate?
 
Skimbleshanks said:
When the other indices are in unison, the trend can commence. They only ever trend together. So when they are not in unison, you are guaranteed a trading range.

Skim - that is simply put.
 
lard42 - if u scroll back on this thread, u'll see a post of mine examining Thursday's price action with more detailed analysis of your question. it is essentially a risk, not price entry management. pls also note skim's comment on that post of mine as it is important indeed.

bramble - let me try to explain. skim is totally right saying that all indices have to participate in a trend, for THAT to be a trend (well apart from some most weird days, my favourite example would be "asbesto court ruling" days - since 80% of Dow issues r exposed to asbesto, I've seen perhaps 2 or 3 days over the past 5 yrs when NDX wud travel miles with Dow stuck beause of some asbesto ruling). HOWEVER, imo in an ideal case scenario, % wise the indices wud travel strictly according to their DAILY BETA ratios. E.g. on an ideal trend day, if SPX is up 2%, XBD wud have to be up 2.86% or so (daily beta of 1.43).

Therefore, if SPX = XBD = up 2%, the leading group is actually lagging the broad index.

I DO understand that we r traders here and not mathematicians (thank God :) ). Assume it is 10:30 (or any time really as Skim rightly says), and SPX is up 2%. It'd be silly to say that if XBD is up 2.8% it is lagging, whilst if it is up 2.9% it is leading :) However I do trust broad ranges of index crosses to determine what sort of day we r dealing with.
 
China,
I had NEVER before understood that beta stuff until now! Probably due to lack of research on my part, anyway it's now clear, so I thank you. :D
While we're on the subject, could you let me/us know the beta of Sox?
Cheers
Q
 
mate i have no access to Bloomie terminals here in the Americas :(, my vague recollection it is ruffly 1.5 to broad tech index, but i am not sure
 
also dont forget, that strictly speaking u want a leading group not just with high daily beta, but high correlation to the broad index (beta may be 2 on avg over the past year but jumping from 0.8 to 3.2 - for an absurd example - or alternatively only 1.4 but almost always btwn 1.3 and 1.5), that bolis down to dispersion sigmas on daily readings for the purposes of beta definition. the reason why xbd and sox work so well as leading groups is exactly that.
 
what r the odds for the next move?

look at 15 min ES.

the early May bear flag duely delivered - its target fully met - 2 shorter yellow lines of identical length.

what has bn going on recently (larger yellow line) I cannot but view as a larger scale bear flag with 2 ominous things:

- 50% Fib NOT EVEN approached;

- attempted 3rd knock on the upper bound of the flag failing half way.

the bulls still have a glimpse of hope (like Millwall on 43rd minute :devilish: ), since the lower bound has not yet bn violated on the close. BUT.... what are the odds here?

just an observation here on the FA Cup Final day. U wudnt believe it but I had to cross into Mexico to watch the game (no yank bars I know wud show it). Probably saying the same things as the bulls here - "we still r going to Europe next year" :devilish:

cheers
 

Attachments

  • E-Mini S&P 500 (Jun. 2004)- 15 minute.jpg
    E-Mini S&P 500 (Jun. 2004)- 15 minute.jpg
    48.6 KB · Views: 226
Monday 24th lines of thought

one of those messy days that will not make u rich ;)

First short at 1100. All further trades are reversals. Dotted lines r stoplosses. U can see a few times trades were just break-even :(

Full tick pos div at 13:00. Very nice signal.

U can also see that following Tick's 2 ma (5 min) - idea of StopLoss - can be very useful.

XBD - extremely supportive for reversing to Long at 15:00.
 

Attachments

  • CME-ES04M- 2 minute.jpg
    CME-ES04M- 2 minute.jpg
    62.4 KB · Views: 194
  • Nyse Issues Up&down Ratio- 5 minute.jpg
    Nyse Issues Up&down Ratio- 5 minute.jpg
    34.3 KB · Views: 217
  • Securities Broker Dealer Index- 5 minute.jpg
    Securities Broker Dealer Index- 5 minute.jpg
    36.2 KB · Views: 221
China

This is the one I noticed today. Came at the end of a 5 move down (????) on the 5 minute chart and reversed off previous close. The VXN cross beneath the 20ema rule. The TRIN was a dog but the VIX worked a bit.
 

Attachments

  • Dow 5min362.png
    Dow 5min362.png
    57.2 KB · Views: 214
  • Dow 5min363.png
    Dow 5min363.png
    38.2 KB · Views: 220
matey - where hv u bn hiding? :)

stop - with all due respect to wavers - i do not incorporate elliott waves (or wolfenwaves) in my decisions. probably it is just me whoz a bit too thick to see wave structures. we discussed it before - didnt we - I find it the most subjective thing in trading... however my hat off to ppl like voo and skim who can do that - and very successfully.
 
Just been a bit busy m8.

You are right about waves being subjective. If a wave stands out on a chart, I use it. If I have to look to hard, I don't.

I prefer to count bars. Apart from the inside bars, you had five LL in succession on the 30 minute chart.

IMHO the latter bars indicated that the selling was drying up. After 3 to 5 bars in one direction and I am ready to jump ship.
 

Attachments

  • Dow 5min364.png
    Dow 5min364.png
    49.4 KB · Views: 211
Tuesday May 25th

An easy and hard day to trade at the same time :rolleyes:

easy in the sence that 1 correct trade wud fetch u 20+ pts on zzzzzzzzzz :cheesy:

hard in the sense that a non-trend (bearish biased set-up) quickly turned into an up trend day. Bearish biased due to XBD pattern at the open primarily, but also from after-hours pattern. At 10:30 time pivot the crosses were still far from being a trend day, with the situation completely changing into the following time pivots. The day was tricky even if u define trend according to Lynda. As u can see ADX(14,14) stormed thru the 30 level only after 11:00.

Now - an analysis of trades and mistakes today.

Clear short at the open (look also at XBD chart), followed by 3-incremental bottom. All'armi! :LOL: Rev to Long flat. Faster fingers cud make 1-2 pts out of this short if they noticed that 3 incremental bottom pattern.

11:05 - massive Inverse Tick pos divergence on a continuation pattern at 20 ema/5 min test. if u r not long yet, a clear sign of "holy grail" holding => huge chances of a trend day to follow.

Up until 14:30ish - zzzzzzzz - watching ducats clocking up :cheesy: NOW MY MISTAKE I MADE at about 14:30:

On a very "shallow" (I do not know how to describe it better) conversion to LHs and LLs I looked at XBD %, saw it lagging quite badly, and shorted 1106.5. WRONG!!!! If u look closely at XBD chart at that time, even though by number it was lagging, it was rampaging up, with clear cut HHs and HLs (if there were any lows :cool: ), unlike spx which was holding its breath with "shallow" LHs-LLs

Rev back to Long at 0.75 pts loss (and obviously another 0.75 pts missed opportunity). Relatively unscathed, but if the natural stoploss on that short (1108.50) was hit before the following HL, it'd be 2 pts loss + 2 pts unearned money.
 

Attachments

  • CME-ES04M- 5 minute (all sessions).jpg
    CME-ES04M- 5 minute (all sessions).jpg
    55.8 KB · Views: 233
  • Nyse Issues Up&down Ratio- 5 minute.jpg
    Nyse Issues Up&down Ratio- 5 minute.jpg
    33.7 KB · Views: 217
  • Securities Broker Dealer Index- 5 minute.jpg
    Securities Broker Dealer Index- 5 minute.jpg
    38.1 KB · Views: 216
China, I was looking at the same tick chart yesterday and that spike down which you have called an inverse pos div, looked to me like confirmation of a reversal and prevented me from jumping on the uptrend.
Advice on how you interpreted this as a pos div would be much appreciated.
Thanks,
hampy
 
Hamps

Three clues.

We only had a three bar retracement that did not reach the 50% mark or the 20ma. Its then a case of trusting your gut and trading the 123.

Once the tick recrossed the zero line and then resided above it, every retracement was an opportunity to go long.
 

Attachments

  • Dow 5min366.png
    Dow 5min366.png
    97.4 KB · Views: 244
hampy when say on the way up u get a maribozu followed by a few dojis, and es records higher prints on lower readings of tick (inverse tick pos div) + all this happens at "holy grail" test - all this means only one thing - "ship 'em in"! :)
 
MACD bounce off zero line

Hamps

Another entry the works well is the signal line bounce off or near the zero line on the one minute chart.
 

Attachments

  • Dow 5min367.png
    Dow 5min367.png
    113.3 KB · Views: 225
Top