Trading ES (Q2 2004)

Do people find this thread useful?

  • waste of typing time. pls trade your ideas in silence :(

    Votes: 0 0.0%

  • Total voters
    34
matey always look at what an index in Q is comprised of :)

25% of stoxx is just 4 big cap UK blue chip stocks. does it send a msg? u trade an index like stoxx the way u trade individual stocks - pure price action, EVEN if STOXX had its own Tick I'd be very careful interpreting that tick - made of 50 stocks max with just 4 big players :)
 
just another illustration of what I mean:

when u trade MIB30, do u think u trade an index? what u actually trade is Telecom Italia (TIT.MI and TIM.MI) and FIAT. u c what i mean?
 
China,

Good points. I did look at tick (supplied by mytrack) for ftse 100 at one point. Just as you point out in relation to mib and stoxx, cap weighting of the oils and banks makes it virtually useless.
 
Bramble,

Grey1's point was that he still uses the 50 point rule even thugh it originally related to rule 80a on collars.... that was then replaced by the 2% rule in 2000. Irrelevant I know..... ;). I only mention it 'cos nyse have changed the collar levels for Q2 2004. They are now 150 points (down from 200).
 
Bigbusiness said:


Interesting idea but I have lots of charts with a 50point move at the open followed by a choppy day. Some days do move 50 points and then trend all day but I find the opening move often returns back to the opening price.


By trending, I'm talking about significant moves - any number of them - in any direction. I don't care if it moves up 150pts then back down 450pts then back up to where it started. For me, that's a trending day with 3 magnificent trends!

By oscillating, I mean meandering about in a (relatively) narrow range.
 
sandpiper said:
Bramble,

Grey1's point was that he still uses the 50 point rule even thugh it originally related to rule 80a on collars.... that was then replaced by the 2% rule in 2000. Irrelevant I know..... ;). I only mention it 'cos nyse have changed the collar levels for Q2 2004. They are now 150 points (down from 200).

Sandpiper. Can you translate please?

What was the 50pt rule?

What was rule 80a?

What is a collar?

What is the 2% rule in 2000?

What are the nyse collar levels for 2004?

Why do I think I'm a trader if I'm asking all these questions?
 
matey - that relates ro the levels that once hit - trigger stopping trading of futs for 15 mins

on an unrelated note - just got an angry msg from a MIB30 trader. SORRY forgot to mention Tiscali (TIS.MI)! Mi scuzi tutti! :)
 
Bramble,

Rule 80a governed program trading restrictions when the dji reached either +50 or -50 points. Essentially, it meant that once these levels were hit buy programs could only be executed on down ticks and sell programs on up ticks. Given that even at that time program trades made up 50% of NYSE volume the restrictions were quite siginificant.

They changed these levels to be 2% of the dji quarterly opening value in 2000.

The collars for quarter 2 2004 have been set at 150 points (down from 200). This means that if the dji moves up or down 150 points from it's previous close program trading curbs are instigated retricting the execution of buy and sell programs on the NYSE stocks until the dji retraces a certain number of points.

Program trading still makes up a large precentage of NYSE volume but clearly, a restriction of 150 points now is not nearly as siginificant as 50 points was in the mid/late 90's.
 
Expanding triangle been forming over the last two weeks making it relatively easy to pick the tops and bottoms.
 

Attachments

  • untitled.gif
    untitled.gif
    152.5 KB · Views: 299
Also seems to making a mirror image on the day chart if you take the centre as 2003.
 

Attachments

  • untitled.gif
    untitled.gif
    152.5 KB · Views: 267
what now?

tempting to interprete this as an Inv H&S in the making, with the target around 1120. Dark siders wud also perhaps note that the right "collar" is higher than the left one, which is a good thing for the bullish case.

However, if u take a look at XBD which i trust loads as a head's up to what's gonna happen on SPX, u'll see that it is massively underperforming SPX which is not that good for the bulls.

i'd still say that the recent Higher Low on XBD points to short-term strength, perhaps that Inv H&S delivering.
 

Attachments

  • CME-ES04M- 60 minute.jpg
    CME-ES04M- 60 minute.jpg
    43.1 KB · Views: 236
  • Securities Broker Dealer Index- 60 minute.jpg
    Securities Broker Dealer Index- 60 minute.jpg
    49.6 KB · Views: 219
China, which exchange is XBD on please? I can't get data for it, so I assume it's on one of the exchanges I'm not signed up for.
 
lads/lasses - a bit of a confession here... :)

ANTICIPATING your questions - YES I still take Tick, Sox and Xbd as "head's up" signals (precursors if u like) in my trading. No changes there. All previous elements of the system fully intact.

HOWEVER - I now enter my trades ONLY when those signals are confirmed by what some of us call dark side :) - that is e.g. when I get Tick positive divergence confirmed by the sequence of LHs, LLs changing to a recorded HH followed by a HL where u nail your long. As an example of course - today it was the opposite :)

Skim and the others - my hat off to u. :)

Today's loss of 1102.5 (1102.25 printed) signalled Short in the afternoon. Was a bit tricky at 1096 level, however equal lows on ES were mirrored by Lower Lows on all techs and Xbd - SHIP 'EM OUT!!! Short 1096 was indeed the best trade of the day.

AGAIN I am perhaps not an orthodox dark sider :) as I use all my bits (like Tick or Fib grids to see divergencies across indices) as hints for future action, BUT it is the price action that makes those hints work (or fail). As someone said: "an option trader is a person with a rare ability of an exponential learning curve". Many thx to all darksiders who made me think again and again and again :) and brought that learning curve of mine to the new orbit :) I feel truly honoured to have met all u bright lads/lasses on this site!
 
2 min action

something I wanted to share with everyone - something that only recently struck me with its simplicity and beauty. Experienced darksiders pls forgive me if I am divulging Pinoccio's secrets here :cheesy:

2 assumptions:

a) It is a NON-TREND day; and
b) u just go for bigger trades, that is u don't scalp.

I will come back to these assumptions later.

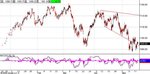
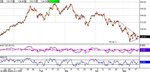
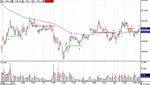
Now look at any pair of good entries from today: A-B, C-D, E-F etc.... We are looking for the points where a sequence of HH, HLs changes into a sequence of LL, LHs (or vice versa). Let us talk about C-D short entry e.g. WHERE DO WE ENTRY at exactly the same price, at C or D?

At point C u r guaranteed a LL, so previous sequence of HH, HLs has obviously gone pete tong :LOL: However, u will obviously have a LH at some point soon (point D) which is also a good thing for selling high :cool:

IMHO shorting at C (on break-down of previous Low) is GENERALLY A RISKIER ENTRY than shorting the next LH (point D). HOWEVER, at point C u perhaps DO WANT to short C rather than waiting for D, because by 11:00 u had the "full house" of Tick neg div, Naz neg div vs. SPX and XBD neg div vs. SPX.

By contrast reverse to Long at E-F level would perhaps justify waiting for the pullback to F (HL) rather than jumping in at E, since Tick, SOX, XBD etc. hints were rather vague at 12:30.

Now my assumptions:
a) This works on non-trend days. On a trending day, pullbacks WILL NOT go as low (high) as previous High (Low). 20 ema/5 min rule is the best u can get then.

b) of coz if u scalp, u want to squeeze pts out of jumping in at E, bagging 1.5 - 3 pts, and then safely re-enter at F point.
 

Attachments

  • CME-ES04M- 2 minute.jpg
    CME-ES04M- 2 minute.jpg
    56.6 KB · Views: 263
The horizontal lines you've drawn are also balance points where the market retraces 50% of its prior move before continuing.
 
actually a nice observation Skim which ties in with the fact that since on TREND days u get smaller pullbacks (38.2% max), 20 ema/5 min rule replaces the retest of the previous High/Low from the other side.
 
Top