Trading ES (Q2 2004)

Do people find this thread useful?

  • waste of typing time. pls trade your ideas in silence :(

    Votes: 0 0.0%

  • Total voters
    34
P&F Tick

Hi all. Hope you all enjoyed Easter.

The P&F Tick divergence is coming along. Def easier to read than bars or candles. Ho
 

Attachments

  • dow 5min350.png
    dow 5min350.png
    69.3 KB · Views: 374
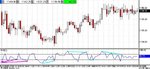
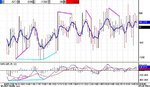
Hi folks, 2 Questions Please, first one for China,

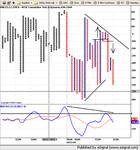
After the 1st hour's big drop, it looked like a trend down day ( correct call with hindsight ), EXCEPT that SOX:COMP was not in line, everything else was 2:1 or better. This prevented me from shorting the pullbacks/ staying short all day.
Any advice on how to treat SOX in the future?

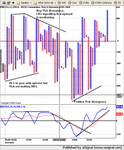
How to get short in the first hour ?
My Thoughts: Using 5 min bars/candles. 5th bar was a pullback, so as the bottom of this bar is breached by the 6th one forming, go short. I'm now thinking that this could be one of Skim's 5 waves, but not confidant enough to take the trade, hindsight would have proved this a good call.
Did anyone manage to get short in this 1st hour using a different method? I'd be grateful if you could point me in the right direction

Thanks, hampy
 
Ultimate Dark Side

Hamps

No candles, no bars, no indicators, no volume, just price.

Beginning tp use P&F with my other set ups.
 

Attachments

  • dow 5min351.png
    dow 5min351.png
    36.6 KB · Views: 344
SLP, Sorry don't know anything about P+F, so need a bit more info.
BTW, does e-signal produce that chart for you?
Cheers. hampy
 
Hi Hamps

eSignal do provide it as one of their chart options. Point and Figure charts are good because they take out a lot of the noise.

Just sent you a PM.
 
Thx mate, that's it for today, the pub beckons :cheesy:
Talk tomorrow.
hampy
 
hampy - answeing yr Q - I personally did not even look at the screens after the 1st hour - did not take any positions today - just kept my June 1100 puts - which perhaps WAS the best trade of the day (not to trade at all! being short from the puts). Now I cashed out not only on the down move but also on the exploding volatility - yes of course it's not that simple as I moved up the skew, but I benefited from exploding skew.

U will also see that it was only the June skew that blew up - Sep is pretty much flat, apart from the horizontal shift up in volatility, which means that the mrkt is STILL VERY complacent. Joys of being long front-end down strikes on a down side move .... :)

Nothing comes free tho :( and I did pay cartloads of Theta on my long vol position over the Easter w/e....

As for SOX - u r absolutely right Hampy - it DOES suggest there is strength in the market, and I do not expect to see 3-digit SPX prints again soon. But pls do not forget it IS an important but still a SECONDARY cross!

On a day like this playing the "holy grail" - or the way I call it playing 20 ema / 5 min is a good call. And if u r wrong (from SOX) - u have a tight stop loss anyway.

Hampy PLS remember that trading is not saying 2.0/0.99 > 2:1 as mathematicians would do. It just gives u the BEST ODDS UNDER CIRCUMSTANCES!

When it rots it rots and u stay short mate..... SOX gives u a hint things may reverse, but if it does not happen u short again :)
 
stoploss
pnf does not recognise time. Don't know how esigs charts are drawn but they are wrong if there is a tick/time interface. Pnf is concerned soley with price and only reverses with set price change which is totally unconnected with time
 
Hi Rognvald

The only option eSignal gives me is a box size and a reversal factor. I do not see it being a problem.
 
China/SLP,
Thx for the replies, just trying to get a feel for the system before upping my stakes!

hampy
 
Tick P&F

I am looking more at the Tick P&F then the Tick Bar chart. I find it easier to read.

Here is todays chart.
 

Attachments

  • dow 5min352.png
    dow 5min352.png
    72.1 KB · Views: 420
P&F ES

Still getting to grips with P&F but really useeful when you compare it to 1 and 5 minute bar charts. Def helping in my decision process.
 

Attachments

  • dow 5min354.png
    dow 5min354.png
    48.3 KB · Views: 415
As this thread's not been used for a while I thought I'd post today's amateurish attempt at ES trading.
My Es chart now has RSI attached inspired by Chartman's Dow thread. Today, I managed to illustrate how taking RSI divs from the open as an entry can be dangerous, the 1st 2 failed to deliver
and I guess China would describe the accompanying tick div as embedded, part of a better one in the making.
You price action guys/gals would no doubt point out that it was all LH's + LL's at this stage, and so i should have taken the 1 pt long scalp when it offered. i didn't and got stopped out , -2.2
Shortly after a decent tick div with the next RSI div, in synch, called the bottom for the day. Didn't take this, too busy working out were the 1st trade went wrong.
Later on 3 different tick divs failed to call the top, but the 3 peak RSI was spot on.
Another point of interest for me was that with a 3.5 pt trailing stop I may have survived my poor entry, and ridden the waves up
for about 4 pts.
All comments/criticisms gratefully accepted, charts follow.

hampy
 

Attachments

  • es23apr04.jpg
    es23apr04.jpg
    43.7 KB · Views: 332
Hampy,

Maybe your RSI setting is to low? Setting of 14 doesn't show the opening divergence.

I'm currently experimenting trading the Dow 5 min and comparing price/rsi against price/macd

Not sure that price/macd is giving me anything more than price/rsi.

Also, the most important thing is figuring out whether its a trend day or not and then applying the indicators accordingly - but realising that early is easier said then done even with China's trend rules.

Today was non trend in the morning, so I took the PD bottom and then it turned into a trend - If i had exited on MACD histogram ND it would have been far too early. There was no divergence on RSI or MACD itself.

Cheers
 
I don't trade ES (yet!), but Grey1 had a fairly simple way of determining if it's a trending day or not.

If the Dow opens +/-50 pts (or does so within the first few minutes) it's a trending day, otherwise it's an oscillating day.

I don't know how well this fits as a general rule, but for the short time I've been using it, it's been better than anything I've used before.

And you're spot on in saying you need to fit your indicators to the type of market. And I'd go further and say not just on a 'what sort of day is it?', but also to match the specific instrument. This really is trial-and-error and totally dependent upon personal trading style, timeframe and strategy.

If there were a 'one size fits all' we'd all have discovered it by now!
 
Thx for the reply's.
Been thinking :
In price action terms, LH's + LL's, we were on the way down.
However with several RSI + Tick divs the key was to decide whether it was trend down or not. All morning SOX was in the region of 1% up, and therefore you could reasonably expect a reversal at some stage.
The div I took was too early, after 3 white candles it continued down, however I had plenty of time to get out at break even which i failed to do. I could then have re-entered at the next div which was at the bottom, and collected 6 pts.
I wider stop would have prevented any losses but would only have yielded 3-4 pts.
Another day to file in the memory bank for future use.
As for RSI setting I shall stick with it. I reckon chopping and changing looking for the holy grail is just wasteing time.
Better IMO to learn the nuances of this one and hopefully then experience will filter out the good divs from bad.
As for the trend days when DOW +/- 50 , sounds a bit simplistic but I'll bear it in mind in the future.

hampy
 
If the Dow opens +/-50 pts (or does so within the first few minutes) it's a trending day, otherwise it's an oscillating day.

Interesting idea but I have lots of charts with a 50point move at the open followed by a choppy day. Some days do move 50 points and then trend all day but I find the opening move often returns back to the opening price.

I have also observed that trending days can start off quite slowly. There isn't an obvious direction for the first half hour.

There can't be many people who can tell if a day will trend or be choppy because if there were, they would all be in the Sunday Times rich list :)
 
I am being asked about Tick sort of indicators for other exchanges. think it'll be interesting to discuss it here.

btw - sorry i've been hiding lately - some personal rub****h :)

I used to daytrade STOXX50 and have quite a good feel of that index. I am positive thez nothing like Tick for stox.

I am very familiar with FTSE Techmark (T1X) as I do actively daytrade some UK Tech stocks, like ARM and SGE. Thez nothing like Tick on T1X

I am not familiar with any Tick-like indicators in the UK in general. I HAVE heard tho that MIB30 recently introduced their version of Tick - but I never actually checked it. Even if they did, Tick on 30 stocks must be quite "raw" - if u c what i mean.

Generally, the great thing about Tick is that it is drawn on 4200+ stocks - so it is a "broad" measure. Still u can c how much it oscillates :) There is this nuisance of counting small cap stocks just as much as big caps - we discussed that matter didn't we on our threads. HOWEVER, the smaller number of stocks u take for Tick calculation - the less reliable measure u get IMO. Even if Italians did it for MIB30 I can't quite see how u can reliably trade on it.
 
China, Stoxx is one of the ones I've been considering.
Is there any particular indicator/s you found useful or did you just go by price action.
Thx,
hampy
 
Top