Trading ES (Q2 2004)

Do people find this thread useful?

  • waste of typing time. pls trade your ideas in silence :(

    Votes: 0 0.0%

  • Total voters
    34
Excellent posts from both of you stalwarts. :cheesy:
I too, was trying to get in at E by waiting for the break confirmation, but I think there were more than a few others "mouse hovering" too as I was left in the dust so to speak!
With the risk increased I was reduced to spectating once again. :rolleyes:
Cheers
Q
 
These damned 'No Indicators - Dark Siders' get everywhere!

China, how are you determining if it's a trending or non-trending market you're trading?
 
:idea:

I've noticed from ChartMan's illustrious Dow thread that 1 min consolidations often enjoy three cycles before breaking out and was wondering if this might apply to all timeframes.

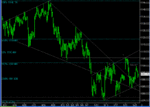
Attached is the hourly ES chart which shows a potential large upsloping bearish consolidation with the third attempt at the top boundary showing classic failure today (though of course as it's only 8.15pm it could still close up!). Given that options expiration Friday is usually pretty flat the bearish action today has added significance, especially perhaps when preceded by the nasty gap and trap 'key reversal' (?) yesterday.

Ideally one would wait for a short at 1106 and/or 1110.5, or even a close below 1086 (we don't trade breakouts though, remember!), but I am very tempted to hold a small swing short into the weekend unless we close above today's high.

Compx and Dow are both below their 200day EMAs and I reckon SnP may just follow. The 200 will usually act like a magnet for a few days but eventually there will be a strong reaction off it. My virtual money's on down.

Tidy!
http://www.cliff-jodie.co.uk/Stuff/TShirtFolding.mpeg
 

Attachments

  • untitled.GIF
    untitled.GIF
    27.3 KB · Views: 223
Bramble - its in one the the longer Technical Trader threads. I believe (correct me if Im wrong CW) that its a trend day if price breaks out of the opening hourly range.
 
fru - very good and reasonable idea. ia m not a fan of holding cash positions into the w/e, however, buying some small amount of puts into today's close (say 1075 strike) is a very good shot imo

bbb and bramble - slightly different :) it is when u have trend ratios btwn crosses (comp/dow and ndx/spx as primary and sox/comp and xbd/spx as secondary) at a particular time pivot, obviously the first one of 10:30 being the starting point for this whole trend definition
 
I believe he also looks at the relative performance of the Dow, Compx, S&P, XBD, BIX and SOX to determine whether we are trending, but my little brain doesn't understand how, or, more precisely, when :)

Sure, I see that SOX and XBD are up 3%, Compx up 2.5%, dow up 1.5% and ES up 2%...so I think we are trending, everything in unison with definite sector leadership...so I'm looking to buy pullbacks to, say, the 25EMA (5min), but is it too late to get on board this trend once it becomes clear? I mean if everything up a few percent and it's all looking blue it might actually be time to fade the move. I don't know how China copes with this dilemma, or indeed if I've got this right at all!

However if some of these indices/sectors are down and some are up we have a bifurcated market and it is likely to be a range day with juicy reversals, which is perhaps when we look for TICK divs at obvious S/R points, among other techniques.

China might be kind enough undoubtedly to clear away a few cobwebs from my ignorant noggin!
 
Last edited:
Frugi

I hope he does - I need it too

Pearl Cobwebs

Pearl cobwebs in the windy rain,
in only a flicker of wind,
are caught and lost and never known again.

A pool of moonshine comes and waits,
but never waits long; the wind picks up,
loose gold like this and is gone.
 
...
A bar of steel sleeps and looks slant-eyed
on the pearl cobwebs, the pools of moonshine;
sleeps slant-eyed a million years,
sleeps with a coat of rust, a vest of moths,
a shirt of gathering sod and loam.*

The wind never bothers. . . a bar of steel.
The wind picks only. . . pearl cobwebs. . .
pools of moonshine.

:D
 
Ah well, on the South side of my capacious Comice pear orchard you will find a clandestine access point to a vast, underground, slightly musty, panelled in luxurious virtual hardwoods....Googlibrary!

Lovely verse though. Hope u have a good one too R.
 
just logged in and found meself on a poetry site.... :)

ok here is how I tend to do it. i'll have to give an absurd example to explain - apologies in advance.

Imagine 2 situations:

a) at 10:30 (or at any time pivot u r checking for trend) comp/dow = ndx/spx = 3 and sox/comp = xbd/spx = 3
with comp and ndx being up say 2%.

b) OR at the same time comp/dow = ndx/spx = sox/comp = xbd/spx = 1 with comp and ndx being up 3%

Obviously in the conventional sense of a trend day Option b) is a strong trend. BUT MY Q IS: for the purposes of trading ES, what is more trend?

The problem with Option b) is that SPX has already fully caught up with the tech leaders and as far as sox and xbd leader groups are concerned, they are effectively lagging the broad indices (since e.g. xbd has beta of 1.43 vs. spx but only at par with it at the given time pivot).

As I see it, it is the % btwn indices (crosses) that define a trend set-up at any particular time pivot.
 
cw
thx for that - it (the poetry) was needed (by me anyway) :) - its been a long week
 
China,
It had slipped my mind that you look for trend at certain times. I recall that 1030 and 1300
( EST ) were 2 of those. Are there any others that you find particularly important?
Thanks,
hampy
 
Are any of you ES traders familiar with this blokes method? No idea if its any good, but I understand the system has a large following - the free manual may interest some of you:

http://www.simple-as-123.net/

May be its been mentioned before?
 
I just look at the price bars to know whether there's going to be a trend or not. If you know how the market 'tops' and how she 'bottoms' then you know that once one of those has occurred a trend will result. This works in all timeframes, so just by looking you can see each of the trends unfold in its own timeframe. So a day may start off in a trading range, then go into a trend, and vice versa.

You can also tell by looking at the bars themselves, the style and magnitude of the waves, and by looking at the volume. When the other indices are in unison, the trend can commence. They only ever trend together. So when they are not in unison, you are guaranteed a trading range.
 
As Snake says in the Simpsons when he steals a pitifully obsolete video recorder: "Oh no, Beta!".

Thank you for making me think, think and think again CW. Now where have I heard that before ;-)

BBB Cheers for Marsh Jones link. Apart from a slightly weak use of MAs the man has plenty of useful pearls (and I say that knowing he is far better trader than I) and I committed his simple123 manual to A4 a few weeks ago. I'd recommend it too.
 
Last edited:
hampy 14;15 is of mega importance. Also if u trade after 15:15 in the last hour, 15:00 can prove to be rather "kinky" :)
 
Friday action

ok how i saw it:

on the first chart red solid lines are S, green solid lines are L, black thin dotted lines - stop losses, coloured dotted lines - either more risky entries, or covering your position without reversing.

the 2nd chart of 5 min NDX is shown to explain tricky yellow C and pink G lines on ES.

1) from after hours action - Short A. Riskiest trade of the day IMO, as after hours patterns are most vulnerable at the open, on this particular trade it was a whisker away from being stopped.

2) rev to Long B. A riskier entry right after the hammer, or a safer one a tad later on a guaranteed HH.

3) first inverted hammer on ES at 11:10ish. Tempting to close Long. However 2 considerations - firstly we do not get LLs (equal lows at yellow C), secondly, NDX 5 minutes showing clear continuation pattern (see 2nd chart). Things look even better on XBD 5 minutes.

4) second inverted hammer on ES at 11:40ish. Confirmed by a morning star on NDX 5 min. Confirmed by XBD and SOX struggling at Thursday's HOD with ES being miles above - negative divergence across indices at the resistance level. The only psychological motivation to stay Long is the "shine" of 1100 level :cheesy: Not enuff reason to stay long imo. AT LEAST close long.

5) short at E. Again a riskier entry (riskier because despite all said above, there had been no prior LLs only LHs before that) - or a later safer one at 1096.75

6) rev to Long at F. Risky punt for 2 reasons - firstly ES displaying rather continuation pattern (high odds of a bear flag), secondly NDX not exactly recording a HH - well sort of but lacking conviction as it is still below the 14:00 High. The author actually went long at 1093.75, quickly rev back to short at 1092.50, cost me 1.25 pts loss + 1.25 unearned money :(

7) Long at G - clear dbl bottom on ES, with second bottom higher than the first one on NDX - positive divergence btwn them.

Good w/e to all :LOL:
 

Attachments

  • CME-ES04M- 2 minute (all sessions).jpg
    CME-ES04M- 2 minute (all sessions).jpg
    60.6 KB · Views: 239
  • Nasdaq-100 Index- 5 minute.jpg
    Nasdaq-100 Index- 5 minute.jpg
    42.6 KB · Views: 223
Top