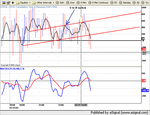
Trading ES (Q1 2004)

Andy,

Well, AMTD and GS seem to be making good moves in XBD. MWD is the one that seems to be creating the indecision. Can't say about the accumulation. Looks to me like MWD could go either way. Not really my thing, but 57 bucks looks key for some reason.
 
Andy,

No, not really. Don't have a chart of SOX and XBD up. Just the ticker. NQ, ES and YM + TICK and then 1 chart that I use to flick between stocks to see what's making the indices move.
 
No reason why you can't (flick that is).. ;).

I have to have ES, YM and NQ set up on full screens 'cos I'm blind as a bat..... For the stock window you just set up a summary window and then set up a chart with a "link" so that when you click a symbol in the summary window it changes the chart. Straightforward enough once you get the hang of it.

Oh.... sorry, I get you. You mean you get confused if you flick between charts?.... Fair enough.
 
Whipsaw away

Really whippy range. Apart from the morning move was really boring.

I wanted to stay on the long side but for some reason the action was telling me that any move we would have would not be that smooth. Got bored at one stage and decided to watch the Simpson's.

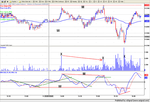
Back to the action. Finally started to get signals after 13.20 EST. The MACD being a good heads up again. The Tick gave some clues too.

Really need to move away from the Spread Betters to take advantage of the set ups. No point competing with the bookies. The Market is hard enough.
 

Attachments

  • dow 5min333.png
    dow 5min333.png
    89.2 KB · Views: 313
Tick

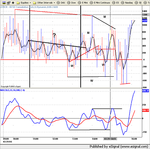
Sorry, looks messy. I mentioned that I thought what we were seeing was accumilation. The tick staying above zero but slowly down ticking. The whole process took from 10.50 to 13.25. I was hoping that the move up would bring a nice bounty but it did not deliver. :confused:
 

Attachments

  • dow 5min336.png
    dow 5min336.png
    61.9 KB · Views: 304
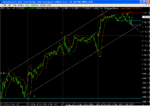
Hovering around the bottom trendline pre-market
 

Attachments

  • untitled.gif
    untitled.gif
    73.2 KB · Views: 293
SOX gave direction

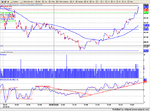
The XBD did nothing today. The ES completed its W bottom and the SOX spent it's bearish energy. Once this happened, we were finally allowed to move up.
 

Attachments

  • dow 5min337.png
    dow 5min337.png
    108.5 KB · Views: 278
Does this make sense

China

Have you every looked at the Tick in this way. It signalled the sell off.
 

Attachments

  • dow 5min339.png
    dow 5min339.png
    51.7 KB · Views: 424
tick

mate it is not the way i look at it - but i think u r right. C every1 develops 1's own style :)

my pos here is quite simple - it is 50% fib of the retracement, and I am long a June strangle of 1100 puts and 1150 calls. I did not just lift the offers on the components - worked them a bit to my advantage :). which means funnily enuff - I don't know where its going to go from here - so I want to bank either way :)
 

Attachments

  • cme-es04m- 60 minute.jpg
    cme-es04m- 60 minute.jpg
    64.3 KB · Views: 376
btw we r done here - our little expiry is midnight tonight - I am starting a new thread with a similar name :) hope u all had a good Q1 - and best wishes for Q2! :)

btw u know that alleged City yardstick for traders: "a trader is as good as his last trade"? I personally disagree with that. IMHO a trader is as good as his yearly P/L. Still, a quarter is a good time span. Looking back tonight I realise that if I was sharper (as I shud be) I cud rack up at least 25% more. Just basing on the system I am trading on. But...... we r just humans...... and we DO need some time on the beach even if it comes at the expense of some unearned profit :) Overall no regrets and a brilliant quarter! let us keep up good work!
 
Could anyone tell me where I can get accurate OHLC data for the S&P etc.

I checked on bigcharts, and downloadquotes.com also compared the data to sharescope for the 6th of April and the data of OHLC varied from these sources.

Any help would be much appreciated.

Thanks
 
Top