Trading ES (Q1 2004)

fork stuff

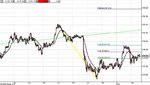
I know some1 is gonna punch me with a fork 1 of these days :cheesy: but I think this is really important.

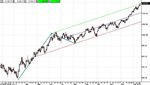
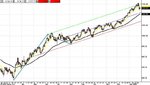
FIRST close above the upper bound of Inside Andrew's Pitchfork OVER THE COURSE OF THIS RALLY. Last time i recall that happening was back in 1997.

Well not exactly a McClose but damn close to it.
 

Attachments

  • s&pdaily.jpg
    s&pdaily.jpg
    46.9 KB · Views: 645
HillBillie
There is no doubt about CCI working..... the real question is just how consistent is it? In the days when I used AIQ, I found it to be excellent in this respect. When I switched to Sierra Charts, there was a distinct difference due to the algorithm used to calculate the values. ( I had the use of both concurrently for a while). I never could get Sierra to emulate the AIQ version.
If you can say that you have used it over a long period, a year or so, and can also say that it consistently delivers, then all well and good .
I think we all know that Woodie uses it to very good effect every day to trade ES futures .
 
CM - may I ask u a Q here if u hv a sec mate. I am postng it here as I think it'll be useful to all.

Firstly, by AIQ do u mean the software from www.aiqsystems.com?

Secondly, is AIQ channel to keltner chaneel what wolfenwave is to Elliott wave - a refined "tweaked" version - or is it a totally diff't calculation?

The reason why I'm asking is that in my younger yrs :) I had really bad experiences on Bollinger and Keltner channels. They r superb in markets jibbering around but IMO tend to give out contrarian signals on penetration when the price slides along its boundary - which is obviously those 10+ pts trends u really want to capture. Of coz u can increase the number of sigmas - but then its becoming a joke IMO - u will trade once a month :)

Do u reckon AIQ is any better in that respect? many thx mate
 
Yes, it was AIQ systems. I never did get to the bottom of it as AIQ didn't ( couldn't or wouldn't) confirm the CCI algorithm. It was most likely a tweaked version of their own. I know for a fact that they had their own version of RSI called RSI_AIQ......
No, I don't think it was any better or worse than anything else, except the platform was out of the DOS ark and there was no such thing as a smoth indicator lines- they were all "stepped" from tick to tick.
 
HB - like I said i am no advice on CCI :) ask me about ticki-tacki and I'll be most helpful :)

CM - cheers mate. many thx
 
1110 area

it is amazing to me how many "big picture" lads on various websites have started preaching on the sell side - and how quickly they turned around on their heels :D - quicker than a pro tango dancer :cheesy:

this is how I c it. A quick penetration of the upper bound of the pitchfork - after an extended parabolic run - was rejected, which is not too surprising at all. However, we r firmly within the upper half of the pitchfork channel with its center line providing strong support around 1110.

I DO THINK that 1110 will be tested next week - just to give the springboard for a run back to the upper bound - which at that time will be around 1160.

just my opinion of coz
 

Attachments

  • s&p 500 index (cboe)- daily.jpg
    s&p 500 index (cboe)- daily.jpg
    50.4 KB · Views: 487
1110 area (continued)

which is btw very consistent with 38.2% Fib retracement of the latest parabolic run - coming in at 1107. Plus (from the previous chart) 50ema/daily is also around 1110.

All this makes me think that 1110 is an exceptionally strong support and u'll get dippies all over the place slightly above it.
 

Attachments

  • cme-es04h- 60 minute.jpg
    cme-es04h- 60 minute.jpg
    56 KB · Views: 484
Fib anchor points

ok - anticipating some critique from those who call the choice of Fib anchor points a bit arbitrary :cheesy:

no matter how u define the starting point for the latest parabolic run - u get this mega-support around 1110 (1107-1114 to be precise)
 

Attachments

  • cme-es04h- 60 minute.jpg
    cme-es04h- 60 minute.jpg
    52.6 KB · Views: 481
lph

Major Averages—Primary & Secondary Parameters
Dow Jones Industrial Average Primary Support = 10,367.41 intra-day low (1/13/04)
Secondary Support = 10,094.75 intra-week low (12/17/03)
Primary Resistance = 10,673.10 intra-day high (3/19/02)
Secondary Resistance = 11,350.05 intra-day high (5/22/01)

Standard & Poor's 500 Primary Support = 1,115.19 intra-day low (1/13/04)
Secondary Support = 1,071.14 intra-day low (12/17/03)
Primary Resistance = 1,173.94 intra-day low (3/19/02)
Secondary Resistance = 1,315.93 intra-day low (5/22/01)

NASDAQ Composite
Primary Support = 2,077.09 intra-day low (1/09/04)
Secondary Support = 1,880.31 intra-day low (11/19/03)
Primary Resistance = 2,328.05 intra-day low (5/22/01)
Secondary Resistance = 2,892.36 intra-day high (1/22/01)

Russell 2000 Primary Support = 573.74 intra-day peak (1/09/04)
Secondary Support = 556.91 intra-day peak (12/31/03)
Primary Resistance = 614.16 intra-day high (3/06/00)
Secondary Resistance = 635.19 intra-week high (measured move)


See if I can dig out some fibs, seem to remember 1115 and 1108 a coupla weeks back
 
HB - u may scare some ppl posting charts of that sort :) I myself thot at 1st glance it was some sort of swastika :) sorry mate just joking no pun intended :)

on a serious note - I do agree with Bonsai that pitchfork analysis works on larger time scales, and is quite tricky to apply intraday. just my opinion. HB pls keep on posting (may be slightly reducing the size of the charts :) ) - lets c if it can be applied to shorter time scales. I doubt it, but I may well be wrong.
 
Charts

Sorry about size ,I tend to post what I see, interesting to note that the fork coincided (with the second intersection) today and is now on the pivot .See if I can dig out a few more its an interesting site.
 
dippies

dont want to jump the gun here - but it increasingly looks to me that last Thursday's 1121 is the closest dippies wud let spooz to get to that 1107-15 "rational" retracement level I was talking about.

which wud mean 1164 next week - Fib and where upper bound of the pitchfork is gonna find itself.
 

Attachments

  • s&p5 minute.jpg
    s&p5 minute.jpg
    53.2 KB · Views: 511
China, Are you still trading using your Tick divs system or have you moved on to something else?
hampy
 
no-trend days - tick divs

trend days - 40ema/5 min on naz

aberration days - tick div to spot the reversal, 40 ema/5min naz S/R (or R/S) resolution as confirmation of the reversal

nothing changed Hampy. still trading the same very system. had 1 losing trade in 2004 so far :)
 
Interesting day today seen yesterday

Here's the CISCO KID!

Discovery64.png


Sorry about the size but here's the kids fork:
Andrews_ES.png


Of Divergence and Cisco, is this a three push down(although not 100% classic)?
N60.png
 
HB - good charts

I personally dont trade individual issues' news - but the way I c it - Cisco's earnings (which relates to the past) lower than expected BUT their sales (which is FUTURE earnings really) spiked. I am not gonna be surprised at all if the dippies close CSCO.O UP ON THE DAY by the close :)
 
Thx China, New PC gets delivered on Friday - Can't wait!
We seem to be seeing more aberration days.
IMO this must be the big boys slowly getting out of the NAZ leaving the public to buy at the top whilst switching themselves into the apparently safer DJI. What do you reckon?
hampy
 
Top