Best Thread Trade2Win's 10 Year Anniversary - Day 5 (Anatomy of a Trade)

I was going to write about a trade from the morning, but as I learnt how to trade the morning from T2W, I feel it would be a bit pointless to explain things which are so eloquently put around the forum.

I never traded the US session much at all until December, so I'm still pretty new to it and it's a rather different beast to the London open (where my previous experience mainly lies). I felt it would be better to pick a trade from this period, I think readers will get more out of it, and I'm sure any feedback will be more useful to me. I realise this is rather long, but it is all important to my decision making, so I am guessing should be included.

With every trade, much like with trading as a whole, the first thing to decide is what you want to get out of it. If you want to make a million in a day trading from a score (£20 for our international friends) , it's probably best to reconsider. Luckily, as I'm doing this competition (all for the glory of T2W of course!), my goal is already set before me without me having to make any major decisions.

Today I want to make $5,244 on this demo account before the next update (anytime Monday). I could attempt it Monday morning, but I don't want it looming over the weekend, so that's the goal, $5,224, 25 pips is generally my target (personal reasons for this). Basic maths gives me that I want 25 pips with 21 lots, and then pay $6 in spreads, simples.

I am going to collate my thoughts, trade until I'm done, and then pick the most interesting trade (you certainly don't want to read about me paying the spread).

Trades, I think for most traders, are set into motion quite a while before entry. What I saw yesterday, last week, and last year will to some extent, effect what I do today. This is one of the reasons I think getting back into trading after a break is hard, I at least, need to, as Sanka would say "Feel the rhythm! Feel the rhyme!". This is also my excuse as to why I have thoughts from hours before the trade in question, they're important!

99% of my trades are on eur/usd. I occasionally deviate, but I like the pseudo reserve/reserve pair. She's generally quite kind to me. My thoughts of late are that we're starting to see people want a bit more risk (lower $), and that China has been a bit shaken by the crisis and is trying to diversify into Euros. These thoughts have little to do with my decisions today though. On the other hand, the Euro is currently like watching a slow train wreck.

First thing first: What day is it?

Now I know some of you like to party, but it's more than just forgetting which day it is. Mondays are full of fun from weekend events, there's "Turnaround Tuesday", and Friday (TODAY!) often seems profit taking. It's definitely something to be aware of.

Next thing is to load up a calendar and have a look at the news. Sterling had sales which was rather bad, and mortgages which weren't too good. CAD news was a bit more chipper than usual (must be a national trend!). While I'm not trading these currencies, it's good to look at them,it helps give a picture of where the money is going, what market expectations are. Everything is linked, so everything must be observed. The eur news out of Germany (re: important country), was better, but it didn't have the impact it's known for. Germany isn't the worry in Europe. There are no major holidays today, with that, to the charts!

Even though I trade mainly off the m5 chart, I look at most charts. If you have a good idea what's going to happen in the next few hours, you can sometimes derive from that what will happen on lower time frames. Obviously there's also levels etc which are easier to see. So what do we see today? (you can see from the charts, this was done around half 1)
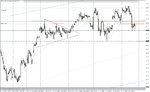
Daily:

Daily.png

Well, last two days we've broken above December's high and then closed below it. We are currently, once again, above it. It has been acting as an important level since mid November, when it was a bounce off some conjestion in September. It certainly looks like it's breaking for a move up.

4h:

4Hourly.png

We can see that the 12pm bars (11am GMT) are where we've had highs of the day, with it being sold off in the afternoon. we do however, now have a close above the level, and instead of a sell off we're still looking north, while not breaking the high yet.

1h:

Hourly.png

We can see that the highs of the last two days are now acting as support (resistance becomes support), this is the 1.3515 level.

This gives me a bullish bias entering the session. It certainly does not mean I will buy blindly, and doesn't even mean I won't sell, but breaks of highs will be preferred to breaks of lows. Some might infer that this means breaks of highs need less confirmation, and thus that I would be getting in earlier on breaks of highs, this is not the case, and is an incorrect leap of logic. If we recall, the target is fixed, my bullish bias is that moves north will be larger than moves south, meaning I can actually afford to get in later.

I decided the best way to explain the trade was to write down my thoughts throughout the day, these are the ones before and during the trade, I would suggest reading through & looking at 5m or 15m chart as that's what I was doing:

ummm.png End of the Day.png

14:40 Currently there are some nice swings on the 5m chart, we're consolidating, but highs and lows are being clearly defined. I am wary of a break above aforementioned 1.335 as there are a few long tails above from the morning, and I suspect we could turn around once again, and a move to be left until next week.

14:49 Varengold updates.

15:12 look at all those tails on m15, pretty certain we're long now, just need the entry, spike down or on a break, I'm not fussy....geez, I'm literally typing my thoughts now....bacon.

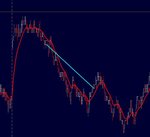
15:18 getting in around 1.3550 would be nice (long)... In at 1.3550, didn't expect it that quick still valid though. Hitting the 5m/15m trendline. Stop @ 1.3540

15:20 Stop at 40, would like to get out before then though. Target is 85, because I have lost 10 so far (oh noes!)

15:22 Gotto let this breath, going to update my spreadsheets (some guys have all the fun).

15:24 Forgot the screencap! Taken one now. I bought at 50 on the 15:15 bar, it's low was 49 at the time if anyone wants to know.

15:27, approaching new highs, now in a slight sell off, this hopefully brings in buyers for further move North.

15:29 pullback all the way to entry, but sticking in, should at least test highs again.

15:43 hanging around this level is a good sign, we're not just spiking up and falling down, seem to have gained ground and holding it for now, hopefully building momentum.

15:45 15m chart looking very bullish IMO

15:52 been away making a cuppa, and we're out. Now to lose $6 and put this in a nice format.

After-fact Remarks (All the above was before/during the trade)

Risk: 10 pips (inc spread)
"Dante Risk": 5 pips (inc spread)
Return on Risk 3.5 (7 using Dante Risk :LOL:)

So far gone 10 pips further, trend line has been crossed, but not properly broken.

General:
Trend up, bought on a large spike down, jobs a good un.

As to the other trades of the day, they were pretty boring and nothing to speak of, just playing around in the chop on the off chance really.

Questions?
 
Last edited by a moderator:
anyway entry was 9914/12, original stop above 9930 area (middle line) , target area 9850 area (above relative lows), stop be moved to b/e when 20/30 profit built in which will be any minute!


i know nothing :-0


Trade exited for 24 pips profit, target area doesnt look achievable today now and alas it be a friday.

There ends todays lesson and you can have that for free :smart:

C_V take note . . . .

I know nothing . . .
 

Attachments

  • audusd exit.gif
    audusd exit.gif
    32.4 KB · Views: 167
Trade exited for 24 pips profit, target area doesnt look achievable today now and alas it be a friday.

There ends todays lesson and you can have that for free :smart:

C_V take note . . . .

I know nothing . . .

I object to being fkt over by 1 pip :LOL:
I am going to get even with it at play time :mad:
Good to see the idea is intact at least.:smart:

WD on your trade :)
 
One last question before I post my trade; When is the deadline for this? I notice you're picking a winner on Monday, so I am now curious as to whether we can post on Saturday or Sunday. I am currently in a trade, but I'd like it to end as I'd feel better posting it in a whole. I'm going to certaintly close tonight, but I don't want to hang around all evening writing about it...?!
 
Today high is 1.3602, about 155 pips from the low. We're off the high by about 12 pips and breaking down through a rising wedge. Also at the high we see RSI was right around oversold area. At the time price broke through down we see RSI confirming by moving below 50.
---------- SELL eurusd 1.3590 stoploss 1.3605
---------- 1st target is around +10 to +15 pips where I'll take 1/2 off and move the stop to breakeven for the other 1/2. Entire will be closed out be end of the day no matter.

Peter

UPDATE: teetering 1-2 pips from stops loss level
UPDATE: Trade closed at stop loss as price popped higher. 2nd chart shown.

See more live calls on the Forex live call thread! Have a great weekend everyone!
 

Attachments

  • eurusd 016.gif
    eurusd 016.gif
    14.2 KB · Views: 154
  • eurusd 016b.gif
    eurusd 016b.gif
    13.3 KB · Views: 169
Last edited:
Hi guys,
No explanation required, my methods are simple yet extremely effective. the real skill is in account management and indeed trade management

GBPUSD

Simple scalp of 3min triangle


Long 15998
Stop 15990
Spread 2pts
Risk 10pts

50% fill order set at 16010 for breakeven

Trade open
Cheers
Wig


How do I post pictures!!:-0
 

Attachments

  • img_12954612282132.gif
    img_12954612282132.gif
    21.5 KB · Views: 184
Last edited:
How do I post pictures!!:-0

Instead of clicking "Post Quick Reply", click "Go Advanced". From here, scroll down a little and under "Additional Options" click "Manage Attachments". From there you can upload your images and manage them accordingly.
 
50% fill hit, trade now guaranteed breakeven:smart:


cheers
Wig
 

Attachments

  • img_12954612282132.gif
    img_12954612282132.gif
    20.7 KB · Views: 157
Instead of clicking "Post Quick Reply", click "Go Advanced". From here, scroll down a little and under "Additional Options" click "Manage Attachments". From there you can upload your images and manage them accordingly.

thanks mate(y)
 
Here is my crude trade, the only thing I traded today. Apologies for the poor sound, my first ever video.

My crude trade

I called my crude trades in Mr Dante's room, perhaps he will vouch for me ;) otherwise I have statements.
Have a great weekend
 

Attachments

  • crude weekly.gif
    crude weekly.gif
    30 KB · Views: 196
  • crude 240min.jpg
    crude 240min.jpg
    384.9 KB · Views: 200
Last edited:
I posted this EUR/USD trade live to my "Spreadbetting FX using TA" journal early in the European session, at 0628 GMT on 21/01.

"Long 3491 stop 3463 target 3543, 3% risk."

My methodology is somewhat similar to that of BBMac, maybe we've read the same books :)

Disclaimer: There are a number of aspects to my trading approach that I prefer to keep to myself, so this walk-through is something of a stripped down version of my actual analysis; the key factors are included though.

First of all let's consider the 30min chart:

1.jpg.

An emerging pattern of higher highs and higher lows - bullish price action suggesting potential for further bullish price movement. The low I've circled is the 5.30am GMT bar. My MetaTrader charts are one hour ahead of GMT.

Now let's look at the 5min chart:

2.jpg

We've established that the 30min chart is showing an upward trend. Is there a signal on the 5min chart that suggests this trend will continue? Yes there is. I have circled the same low as in the previous screenshot, around 5.50am GMT. At that point we can see clear bullish hidden divergence.

So at this point, we have an uptrend present on the 30min chart. We have a bullish technical signal on the 5min chart. Now we need to look at other technical reasons why some buying may occur - support levels:

3.jpg

Once again, I have circled the same low. At that point we can see an interaction with two fibonacci retracement levels and the blue line, which is a 55-bar exponential moving average. 55 is of course a fibonacci number itself!

So we have an uptrend, we have a bullish continuation signal and that signal is backed up by some strong support levels. How to go about entering and exiting the trade? This trade:

4.jpg

...is based on the premise that the trend - the pattern of higher highs and higher lows on the 30 min chart - will continue. That being the case, I enter when the market has moved 50% of the way back towards the last high of the uptrend. That's where I'll enter the trade. My stop is set below that key low - because after all, my trade is based around the continuation of a trend. If it breaks that low, the the trend of higher highs and higher lows will be broken. That's the point where my trade is wrong, so that's the place to get out.

If the trade goes in my favour, then once it has cleared that last high, I look for a touch of the 123.6% extension - that's the first price target and that's where I'll set my stop to break-even. I'll set my limit order to take profits at the 161.8% extension. The 5min chart below has the same low as before circled, with my entry, stop, break-even and exit points displayed. My entry level as posted to my journal includes a small margin of error in order to account for spread, and also for pricing given that I spreadbet rather than trade.

And there you go... a gain of 5.567% from the 2.998% of my account that I risked. It doesn't always work this well - my journal, although overall profitable, has its hit and miss moments, but that was my trading activity for the day!
 
Last edited by a moderator:
Funny thing about this competition.

Out of all the members who posted their trades so far, there are only 3 vendors if I’m not mistaken. So one may conclude that trader_dante, Howard Cohodas and SH-101 do trading as well as vending.

Other vendors are maybe only good at selling training and winning non trading competitions?

PS :idea:May be a good idea to allow hindsight trading - would attract some more vendors.
 
Last edited:
PS :idea:May be a good idea to allow hindsight trading - would attract some more vendors.

Just read the first post properly - trades should have been taken today. It's so unfair to hindsight traders.(n)
 
*snip*

As a bit of an afterthought - here's a 500 tick chart from which it's easier to see the described price action (aka noise ;) ).
Trade12.png

DionysusToast (cheers!) I think you and me trade in a similar way. Like I mentioned before - which wouldn't translate to a blog even if I was at my trading computer - the real entry and exits of my trades are from the DOM.

There are differences though - like, I imagine my strategy like a traffic light system. If it's chop, then it's a red light. If it's trending, then it's flashing amber, and then if i see something in the DOM / time and sales it's a green light for go!

So, for your trade, I might have been looking for longs but NEVER would be looking for shorts.

The trade I posted was really from when the traffic light was "red for no trades" to "amber - OK for shorts". In real life I might have made 2 or three trades in that time, depending on what I saw on the tape. It's rare that I take a trade for 11 ticks.

It's good that you managed to post the time and sales in your trade. There is no way that I could write a journal like yours while I was really trading! Once I tried to "think out loud" into my phone on record while I was in a trade but still wasn't fast enough!

The reason I use a trend "traffic light" system is for a few reasons. If I'm honest i would be lying if I said I designed it this way, but I guess like most people I just followed my nose until I found somewhere warm. One of the reasons is that I use it is because I can concentrate ONLY on longs or ONLY on shorts or I know when its OK to go for a wee. If I was looking to fade a move in shorts or go long on pullbacks I'd go mad I think. The way I have it is that I know what I should be looking for and I think that makes it easier to see.

another reason is that I think I can be wrong in what I saw in the DOM but still get away with it because I'm trading with the trend. I'm not ashamed to be lucky :cheesy:

When it comes to the DOM itself, its hard to describe. If I am looking for long trades, for example, one of the things I will look for is a "heavy" ( I mean bigger than normal) Offer to sell in the orderbook, and then smaller offers to "step in front of it". I think of it like winding up a spring... when offers have come in two or three ticks below the "heavy" one, I look for one price that wont become the offer because there are traders happy to buy it at the offer one tick up. When alot of contracts have gone through at this "lowest offer", I try and buy it too. I also look at the differenc of the "speed" between a normal time and sales and a time and sales filteres to 50 and above.

sorry thats the best I can explain it, it's difficult to describe, but I'm sure you get the gist.

The graph below shows a 133 tick chart (the lowest I can get on my laptop) of the t-note future. The line I have drawn is from the middle of the bar in the minute that I sold it, from the middle of the bar (to the minute) that I closed it.
 

Attachments

  • competition_7.JPG
    competition_7.JPG
    18.4 KB · Views: 164
DR - Good stuff.

In terms of taking a reversal vs a trend trade, it's all down to the 'personality' of the market. So, trading the ES - you would probably end up doing what I did because of the way it tends to move. Otherwise you'd end up buying in the middle of ranges a lot.

I consider myself a 'proficient amateur' at this and am improving gradually. I would like to be trading 10 contracts, out at 5 at Target 1, 3 at Target 2 and then maybe 2 for a runner. Right now having 30% on for the remainder is a bit 'lumpy' in my opinon but I'm not ready for 10 contracts right now...

In terms of the log - it's therapeutic. It is not normally in so much detail and it's normally in shorthand. I do place a log entry as soon as the trade is entered and I don't want the DOM/T&S to wiggle me out, so it's good to take the focus off the DOM/T&S in some respects. I have 1 screen dedicated to my log and I can still monitor the trade when I'm typing if I need to.

I do not normally take screen shots as a trade develops but I thought it was important that everyone saw what I saw at the time - such as the 'double bottom' that then disappeared. I use a program called "Snag it" which allows me to quickly grab screens.

Glad to hear others on here are using this stuff - I hope we can discuss this more on the board.
 
Top