arabianights
Legendary member
- Messages
- 6,721
- Likes
- 1,380
Can I write this over the weekend?
Can I write this over the weekend?
I couldn't reasonably type it up while actually doing it, is the thing...
Pub after work can't be that urgent can it?
Right i'd better keep it simple.
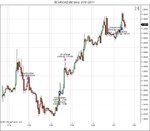
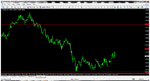
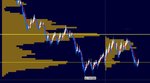
Short AUDUSD
This trade opened @ .9850
Target will be @ .9750
Stop will be @ .9915
Chart 1 shows first and second legs of what I believe will be a third leg continuation move.
Rational for this trade is. Continued relative usd dollar strength versus continued relative aud and gold weakness.
Theres no sense in expanding on this basic premise. Most over complicate analysis to the point where they get nothing done.
Win or lose, this is the trade I am in.
If target is not met, then I will probably close before end of play.
ALAS! The Mighty C_V is out!
The reason for such failure????
Why he did not consult with me!
TutTut C_V i have told you about this kinda of thing before!
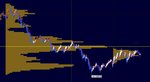
The reasoning behind his trade is so simply true but alas the stop far too inadequate
and suceptible to those same weak shorts he duly mentioned and his entry, well, far to near the lows of the second leg to allow for adequate saftey . . .
i know nothing
just shorted at .9915 😱 :-0 😎 😛
I will explain my strategy first, and then update or add another post when the trade is put on.
I trade T-note futures on the CBOT. My primary strategy relies alot on reading the time and sales, along with trying to spot where other - bigger - traders are working their orders in the market. The basic idea is this:
1) Identify whether the market is chopping or trending
2) ONLY trade in the direction of the trend
3) In an UPtrend, look for big traders working BUY orders (and vice versa)
4) Join them.
However, this is near impossible to demonstrate on an forum. Instead, what I will do is Use a longer timeframe and ignore the DOM just to try and trade with the trend. I can explain the "trend / chop" part of the strategy here but the scalping but - no chance, hence the longer timeframe. Also, I notice that the spread on ETX for t-note futures is 4 ticks wide!
So, I'll b@stardise my strategy in order to make it "post-able" here!
I use Heikin Ashi charts and a 10 period EMA. I look for longs when the EMA is going up and the Candles are "up" candles. Reverse for shorts. If the EMA is going sideways or the market looks like it's in a narrow range, I stay out.
I set audio alerts for y'days High, Low, Onight High and Low, and any High volume areas. I don't put lines on the chart I think they get in the way. It isn't a rule in my strategy I just like to know when it happens.
Next post or update will be screenshots of chart and trade.
anyway entry was 9914/12, original stop above 9930 area (middle line) , target area 9850 area (above relative lows), stop be moved to b/e when 20/30 profit built in which will be any minute!
i know nothing :-0
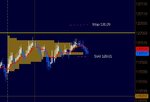
OK, I'm now short from 120.01 with my stop at 120.29
These are decimal prices but t-notes are trades in half ticks of 1/32.
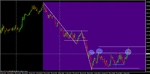
The smaller picture shows the Heiken-Ashi candles are BLUE for DOWN and the EMA is also pointing DOWN - this means that I am only looking to trade SHORT.
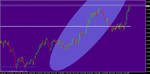
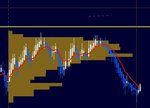
The second picture shows where price is in relation to yesterday. The "trigger" for this trade was the retracement up to yestardays high volume area (yellow line) which coincided with the overnight high. That, and a gap in RTH, meant I reckoned this trade was good r:r.
The stop is places above the yellow line, but this is really only a disaster stop. If I follow my strategy I should be well out before then. Like I said, normally my entries and exots are done with the DOM, and I do end up having trades that go in and out for plus or minus 1 tick. In this case, I will just ride it out until the EMA goes flat or I get two UP candles (in my scalping trading, this is a warning signal for me).
I only did it $1 per point because I'm cheap and at 4 ticks wide ETX are havin a giraffe. 4 ticks is sometimes my Target!