I hope Art wont mind me answering this one.
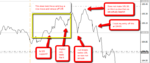
This is my take on it, based on a 7am start of session GMT, the high achieved was around 106.76 and early PA suggest the BRN at $107 was blocking move up.
Therefore any move lower that fails to make LLs will retrace back to resistance and make a LH, unless it of course it goes onto to break the high of session, in which case we will see HHs for the session.
As it turned out S1 @ 106.65 gave way and turned resistant, then there were two big tests from below and they both failed. This confirms for the timebeing R is moving down. These two tests of S1 produce LHs underneath the S1 level, and I think it was the RH test you were referring to.?
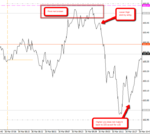
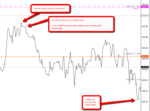
You can see LLs were blocked down around 106.24 - 106.20 so price retraced back up retest previous resistance as it had done earlier @ 10.30 ish GMT. I think the second major retest (12.37 GMT)did move higher just, dep on which broker you use but they key thing is it has not breached session high/or S1. These levels holding and a clear indication of direction.
What was encouraging was the break of the LOW @ $106.30 area (it must give way if price cant go up and break S1) and the LHs under $106.50 as these LHs were effectively rejecting the MP level so the low should go now as R had moved down again.
Hope that helps
Speed