Hi Silvia ,
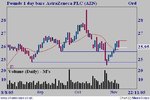
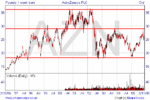
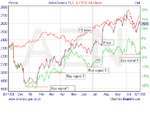
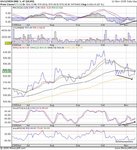
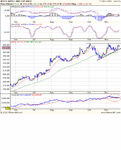
Instead of using relative strength based on historical data I have been looking at it based on the day's closing prices, using FT100 or the Allshare. Sharescope does this by getting the required chart, right clicking and, on menu, selecting "Price Relative to FTSE100" and "Add FTSE100" I would have thought that a better method would have been to divide one into the other and display it as a separate indicator but Sharescope has chosen to display it on the price chart, the problem being that, over a large time scale the graph lines can get too far apart and, over a shorter period the graph gets spikey and more difficult to guage.
Nevertheless, I have been able to identify shares where, although the price has been going up with the index, several days before, the RS line has warned by peaking and going lower.. This means (to my twisted thinking) that when the trader gets a signal that the index is going to reverse, this and similarly performing shares should be shorted. Not before, though, as the price could run up with the index for some time.
Divergence make more sense to me on these charts, too. A lower peak on RS against a high peak on share price means that, when the index fails, the share price could reverse.
This is just an idea that I have been playing with and I don't think that I will continue with it
because the resulting charts look cluttered up and ugly.. Relative Strength makes a lot of sense to me, but only on up to date comparisons with some other index or share. Data based over a certain number of days does not help me, at least.
If there is anything you want criticise or discuss about this I am always interested in ideas.
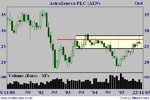
Hi Jon,
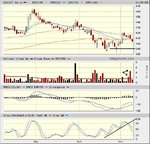
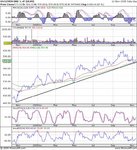
I thought I'd produce your chart to see if it helps. Buy signal 2 did not follow my argument. It went up but against the index but, when the index turned, the share rally fizzled out. Shouldn't have done that!
Oh, well! At least it signalled a price rise.
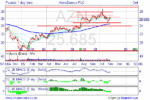
Split