Swing and Position Trading

hey Rex

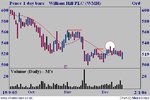
That triangle is actually part of a much longer lower trendline. With it's partner BAE breaking up into new highs it's possible rr. could do the same. I try to stay away from seeing such chart patterns as the eye can see as many as you wish for when your looking for opportunities. I like to stick to moving averages and volume. It's certainly an interesting one.
 
But this opinion is bias as I've been trading this on the last pullback so please excuse me. Still in this trade, possible exit tomorrow.
 
Trying to post a chart.

Help needed.
I am trying to post a chart but cannot get the sizing correct .

I went from sharescope to paint then filed in my documents and then converted to a GIF file ,and it posted on here like it is,not very satisfactory.

How can I improve on this so it can be viewed better,any help would be appreciated.
 

Attachments

  • Xtrata.GIF
    Xtrata.GIF
    30.2 KB · Views: 331
Last edited:
Yep I got it,

Entered XTA myself yesterday, looking for a position play on this stock. It's textbook as far as my strategy goes.
 
techst .
Glad you are on here,I wanted to show you my set up for this, went long this morning , am now in profit . Also went long Rio and just bailed out with some dosh.

I have edited this,was to much in a hurry.
 
I like XTA coz it's at a point where both the long term trend and the short term trend line up. Long term being years and short term being days to weeks. These situations happen after a correction of intermediate significance. In my opinion, the first leg of the new short term trend after the correction is the lowest risk play, Each leg or pullback adds more risk of a reversal. 2nd pullbacks are riskier but generally legal. This concept works for me.
 
techst said:
I like XTA coz it's at a point where both the long term trend and the short term trend line up. Long term being years and short term being days to weeks. These situations happen after a correction of intermediate significance. In my opinion, the first leg of the new short term trend after the correction is the lowest risk play, Each leg or pullback adds more risk of a reversal. 2nd pullbacks are riskier but generally legal. This concept works for me.

Yes I agree with the above.

I have been reading our old mate Elder since about Aug this year and am trying to trade as near his books as I can.

I picked up the screen one position and the waited for the recent pattern on XTA,this was on my ' A' list for about a week.
I also noticed that my 3 EMAs had merged (10 EMA 20 and 50),also I use the 2% deviation lines in Share scope to show tops and bottoms of ranges.
I wanted to show you on the chart. The set up, but need some help to post a good size chart.

Regards Jon
 
mmm, xta still technically in downtrend for me, but the steepness of the october correction did that for a lot of mine - wrongly as it turned out, so your view's probably the better one. above 1417'd change it back to up for me so it looks as though i'll be waiting for the riskier second pullback.

it has been a nicely consistent performer on the long climb up


good trading

jon
 
The charts a little bit iffy, but really it's fine coz you can zoom in on it. Funnily enough i played that first move up that has retraced 100% back to yesterdays starting point. Got in on the break above and then out the next day. I can't recall why i exited early but it payed off.
 
Yeah i can see why beginning moves are psychologically and technically hard to play, but that's why i like them!
 
Techst.

Here is another 1-2-3 set up I used recently AZN.
Have been studying this set up for a few weeks now and use the line charts to show a clear picture of the set up.
 

Attachments

  • azn.GIF
    azn.GIF
    19.5 KB · Views: 306
I spotted that one too. The intermediate correction in the general market that we've seen, really lends itself to my system and the use of 1-2-3's.
 
techst said:
I spotted that one too. The intermediate correction in the general market that we've seen, really lends itself to my system and the use of 1-2-3's.

I am also doing a study of three EMAS merging and provisionally found we get some good moves up when this occures,Im now comparing this with MACD line cross overs .
 
Just to compare, my ema settings track the short term value and the intermediate term value. Short term i plot 15-22EMAs and swing trade early pullback to these averages. I plot the weekly 12/26 on my daily chart using a rough figure of 70,130EMA. These work well for me, and it enables me to see a guide of the weekly EMAs on a daily chart.
 
techst said:
Just to compare, my ema settings track the short term value and the intermediate term value. Short term i plot 15-22EMAs and swing trade early pullback to these averages. I plot the weekly 12/26 on my daily chart using a rough figure of 70,130EMA. These work well for me, and it enables me to see a guide of the weekly EMAs on a daily chart.

Since reading both Elders books.I have quietly been spending time working on his methods and am slowly improving my trading methods based on his books.
I am using Sharescope EOD charts and am using .--- On screen one--- 26 weekly EMAs and I have 50 and 20,daily Emas and also weekly Macd + histogram on same screen.

I also have converted the weekly EMAs to daily ,eg 70 and 130 and experimenting with these on screen 2 charts.

I am currently specialising in one chart component at a time and have just finished searching thru the macd on weekly charts to find any common denominators with EMAS and MACD patterns . I am pleasantly surprised to see Elders method of waiting for the Histogram to tick up to give a trading buy signal.I have found, I need to have more patients to waite for these patterns to work through.
One filter I have found to be very usefull is the 2% Deviation trend channels that are available in Sharescope,these can help show turning points in the charts,similar to Bollinger bands.
I use these to guide me through top and bottom setups,eg 1-2-3 set ups .

Regards Jon
 
Wmh

here's one to have a look at WMH - MACD histo ticks up on weekly and some good divergences on the daily's. - I'm currently working through Elder's books now - very good stuff.

I'm waiting for a decent break of the downtrend line - and connfirmation of this on the OBV


let me know what you think of the attached charts - cheers!!

Rex
 

Attachments

  • WMH daily.gif
    WMH daily.gif
    37.4 KB · Views: 350
  • WMH weekly.gif
    WMH weekly.gif
    31.3 KB · Views: 343
Rex 79.

The first thing I notice,the 26 weekly ema is sloping down,therefore I would not consider going long and would look for a share with the 26 weekly ema rising up steeply.
Then look at the first up tick on the MACD histogram as you say.

Thats only my opinion and I am no expert,but will continue to use Elders methods and find they work for me.
I am trying just two indicators MACD and 14.3.3.stocho like you.
Keep posting in the new year.
 

Attachments

  • WHM.GIF
    WHM.GIF
    51.5 KB · Views: 328
rex

I haven't been trading this one, but you might be interested in how it looks from my perspective.

The last swing high was scrappy and the price did not go on to make new lows for the trend (warning 1) but turned and took out the swing high intraday (circled and warning 2). Because the assumed swing high was so scrappy it's possible that this circled bar represents the true (but still assumed) swing high. In either event, I think I'd be looking for a close above that circled high - 533 - to be thinking change of trend.

Festive greetings and good trading in 2006

jon
 

Attachments

  • whill.JPG
    whill.JPG
    36.4 KB · Views: 271
It's a bit of a messy chart for me, I can see a case to go long and short on this. You've got long term negative divergence on the Weekly MACD and OBV. The stock is in a distribution phase hence the long sideways move. I think alot of strength through 530 might be interesting but then i also think 540 may be a problem. This is what happens when i try to pick a bottom, i see alot of resistance above. It's really a countertrend play which is something i try to avoid. I like the Insurance, Bank and Food and Drug even Retailers at the moment. All of these sectors have printed Weekly MACD crosses from below Zero and have either continued their 3 year trend or recently broke out of bear markets. Keeping an eye on the Weekly MACD is certainly useful as intermediate corrections can print severals waves down but still be within the long term trend of a stock. TSCO is a prime example. The huge move down a few months back may have forced a lot of selling, i even flagged it as a short sell! but looking longer on the chart i could see that the long term trend was holding up.

Good Stuff
 
WMH: The bullish divergence between the lows of October and November and the MACD Histogram is quite mild. However it is still a "hound of the Baskervilles" signal despite the second histo low not being as low as is desirable for strength of the following upward trend.
 
Top