You are using an out of date browser. It may not display this or other websites correctly.
You should upgrade or use an alternative browser.
You should upgrade or use an alternative browser.
Techst,
One recent example is Compass (CPG)
A low of 187p was set on 13 Oct (Low1) and a deeper low of 168.5 on 21 Oct (Low2)
If you plot the daily MACD histogram over this period the Low1 depth was much more so than the Low2 depth.
Elder would say this is a HOB signal for a sustained recovery.
In fact CPG has risen more than 25% from the final low ( a kangaroo tail?)
Without further research, this is the best I can do at the moment.
Relevant pages of 'Come into my Trading Room' are p105-109
Also p75-77.
Last edited:
Hounds
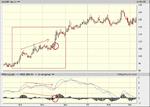
Aspex, the example you gave is an example of histogram divergence.
The Hounds signal is when a stock prints something like the chart provided. OOM begins to print negative signal line and histogram divergence. You would then expect the stock to begin to retrace as the MACD is hinting that this may happen. But, the stock then makes a strong move upwards in the opposite direction of the signal of the MACD. Thus, canceling the negative situation. These moves are considered strong enough to jump on the back off and trade in the opposite direction to what the earlier MACD signals were displaying. As you can see on the chart the stock then rides into a strong bull market for the next 4 months. It's basically a failed MACD signal, which is rare. Hence the strength of the move after
Your more likely to see these types of signals in bear markets when you start to see a stock printing positive MACD divergence only to see the the gap down in it's original long term direction. One way to protect yourself against this is to wait for confirmation that the trend has changed by using my old favorite, a 1-2-3 Reversal.
I didn't understand the Hounds signal when i read the discription in the book. I then listened to Elder himself explain this signal in an intereview you might be able to find this on his website. It then clicked into place.
Attachments
Two Situations
I thought I'd keep this thread rolling along a print a few things I've come across over the last few days.
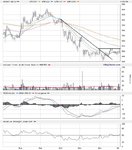
BSY, Although I don't often play countertrend moves, this one is appealing for a short term swing upwards. Just using the 1-2-3 Reversal would see an entry above 505 or a strong close with volume today would also be tempting. I'll let this one play out without me, and just watch it unfold. I just thought it was an interesting move I wanted to watch.
HSBA, Another short term play. More of a sideways move in recent months. But I do feel the Banking Sector is strong with stocks like HBOS breaking into new fresh ground. With weekly MACD's crossing from below 0 on alot of the banking stocks I do feel there's upside potential. The stock is still trending and the recent sideways move has set up a short term play to the long side with nice strong voume to hopefully propel the stock foward.
Any thoughts fellow traders? Or has everyone been wiped out...
I thought I'd keep this thread rolling along a print a few things I've come across over the last few days.
BSY, Although I don't often play countertrend moves, this one is appealing for a short term swing upwards. Just using the 1-2-3 Reversal would see an entry above 505 or a strong close with volume today would also be tempting. I'll let this one play out without me, and just watch it unfold. I just thought it was an interesting move I wanted to watch.
HSBA, Another short term play. More of a sideways move in recent months. But I do feel the Banking Sector is strong with stocks like HBOS breaking into new fresh ground. With weekly MACD's crossing from below 0 on alot of the banking stocks I do feel there's upside potential. The stock is still trending and the recent sideways move has set up a short term play to the long side with nice strong voume to hopefully propel the stock foward.
Any thoughts fellow traders? Or has everyone been wiped out...
Attachments
techst said:I thought I'd keep this thread rolling along a print a few things I've come across over the last few days.
BSY, Although I don't often play countertrend moves, this one is appealing for a short term swing upwards. Just using the 1-2-3 Reversal would see an entry above 505 or a strong close with volume today would also be tempting. I'll let this one play out without me, and just watch it unfold. I just thought it was an interesting move I wanted to watch.
HSBA, Another short term play. More of a sideways move in recent months. But I do feel the Banking Sector is strong with stocks like HBOS breaking into new fresh ground. With weekly MACD's crossing from below 0 on alot of the banking stocks I do feel there's upside potential. The stock is still trending and the recent sideways move has set up a short term play to the long side with nice strong voume to hopefully propel the stock foward.
Any thoughts fellow traders? Or has everyone been wiped out...
Hi Techst.
Noted your comments re HSBA and would just like say I have been long since 21/12 /05 and will stay with it to see how far it goes.Results are due end of Feb.
Also long position with BP. Results due early Feb.
I am not looking for any more longs at the moment not sure which way the market is going at the moment.
I would like to see what you think about the market direction.
PS wish you a happy NEW YEAR.
Market Direction
I see the market negative to flat this year. There's some pretty big cycles playing out in the US markets that indicate weakness in the markets this year. I'll also stick my neck out and say that 2007 won't be a good year either. I'd then be looking for a low in late 2007 in the overall markets, providing an opportunity to pick up stocks at value prices and begin trading them on the way up.
Whether this right or not doesn't really bother me, as there's always opportunities in the market within a short term time scale. The one issue is whether the next intermediate correction is a normal reaction or the start of a bear market.
Morning Techst, Fluke -
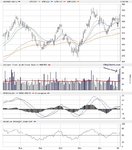
Have been watching BSY for a while - noticing the weekly macd histo ticking up and think that one's looking good.
Just had a look at HSBA - I think that one's going to make a move of about + 40/+60 points, In my view it's about to break an important point at 946, see previous resistance levels, I've also marked a trend line on OBV, once this is broken (I'd be willing to join). i find confirmations of trend in OBV reassuring,
hope they both go well.
Oh - and by the way didn't go long on WMH, not trading at the moment, just watching ..
expecting short term pull back FTSE 100 -
Fluke said:Hi Techst.
Noted your comments re HSBA and would just like say I have been long since 21/12 /05 and will stay with it to see how far it goes.Results are due end of Feb.
Also long position with BP. Results due early Feb.
I am not looking for any more longs at the moment not sure which way the market is going at the moment.
I would like to see what you think about the market direction.
PS wish you a happy NEW YEAR.
barjon
Legendary member
- Messages
- 10,752
- Likes
- 1,863
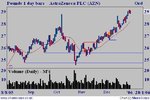
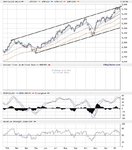
barjon said:you can see from the monthly chart that azn has ranged between £18 and £28 for the last couple of years with pretty clearly defined buy and sell zones at each end. The red line is the Fib50% retracement of the big 2002 down move. October printed a bearish shooting star (the last doji hammer is just so far this month) so whereto next?
The daily swing chart shows a breach of the previous swing low, although the one before that held (blue lines) which may have signalled a trend change to down. If so we've had a series of potential swing highs with the last (just about an engulfing down candlestick) today. No prizes for guessing which way I might jump, particularly if the market comes back.
Good trading
jon
Happy New Year everyone
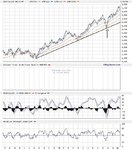
Since I mentioned it back in November http://www.trade2win.com/boards/showpost.php?p=217921&postcount=203 I thought I'd update.
Well, I did go short (first yellow circle) and as it turned out I was very lucky to get my first target (1:1) and was then stopped out on the remainder at breakeven. The price then moved on to take out the red swing high which changed the trend back to up.
Then a very neat first reaction came with a highly profitable - as it turned out - entry signalled (second yellow circle). Did I take it? No, still fixated by my bear views 😱 Just goes to prove you should trade your rules and not your opinions.
Good trading
jon
Attachments
Came into RTR too early at 375 and watched it go to low 350s.
Got out at 423 after swinging to 442.
So is 47 points out of the range of about 90?
I believe so, though I could have pointed to a sell point at about 435.
Still learning but the pain has not been great.
Only two losses in the last 11 trades is Ok but with CFDs there is still the interest cost on 'longs' as a drag.
barjon
Legendary member
- Messages
- 10,752
- Likes
- 1,863
Ah! The burning question flukey my man :cheesy:
For me, so far as shares are concerned, the fall from last week's ftse high has already given me a heavy slate of potential swing lows, which will doubtless increase after today as well as shifting the existing ones to lower levels.
I'll be assuming a correction until earlier and confirmed swing lows are taken out which will change those share trends to down for me.
good trading
jon
Dear Bearie barjon
Just a thought on to-days Nikkei induced fall
It does open up a nice gap to be filled - any takers?
Sorry for the interuption but you know I have a thing about gaps and the treatment han't worked.
Another thought (two in one day can't be good for me) If/when ftse rises to 5700 will this prove to be a resistance level once more and a good shorting opportunity or will it pass over it like a Rolls over a speed bump. Yes I know, trade what you see not what you think but can't help ruminating - bullish pun unintended.
Regards
bracke
Last edited:
Fluke said:Is to days fall in FTSE 100 shares a short term correction, or are we starting a serious down turn.
What do others think,would be interested to see other views.
Hi Fluke
Personally i think serious market downturns don't happen overnight. It's gradual pattern of shifting sideways with the index often looking like a continuation pattern and then key levels are then broken again and then that's when the crashes happen. A crash has never occured the day after a new high in the indices. So there will always be signs. Looking at the chart 5300 would have to be broken before i would consider a bear market. Then a break below 5100 would signal a bear market in my opinion. I try to watch the overall market in a step by step, stage by stage manner. Let's see what happens at 5,600 then 5,500 and so on, I'll adjust my trading according to this.
In terms of Dow Theory Rule 12
" A trend should be, assumed to continue in effect until such times as it’s reversal has been definitely signalled - the odds are in favour of the man who waits until he is sure and against the fellow that buys prematurely."
An example of jumping the gun has been seen at the last major low (between 5100 and 5200) when many thought the start of a bear market had begun, only to see the market return to strength and provide healthy gains for those following Rule 12.
Attachments
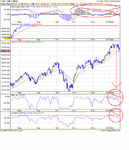
I'm voting this will be quite a serious down turn, (but not the end of the bull run) the MACD divergence on the daily was giving some clues this was coming. (see chart) and the weekly macd starts it's decent ....
Yesterday when I checked only 30 companies in the FTSE were ticking up approx 70 were ticking down (2 weeks ago it was about 50:50).
4weeks before that 69 were ticking up and the minority were declining
I have only recently started keeping records of every company rising or falling in weekly charts - I'm not sure whether it will be of much use but I'll keep recording and watch the patterns.
Rex
Attachments
Last edited:
Similar threads
- Replies
- 2
- Views
- 5K
M
- Replies
- 3
- Views
- 13K