Sorry for this almost infinite post!
techst said:
In my opinion the signal line is the most important and points to better reversals. The histogram does print divergence but i only take triple histogram divergence seriously. I found that the histogram can print divergence for a long time before the market turns. I only use the MACD to hint me towards a reversal.
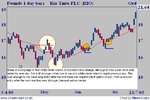
I'll then use the 1-2-3 Reversal method to show me the entry zone. Not many traders realise that this technique is rooted in Dow Theory. I mostly use closing prices for this method. Some traders would wait until the intraday resistance was broken aswell. But my trendline and support and resistance line run through the prices at their close. This does help me avoid being stopped out as it's clear using this method that the trend has changed.
1. Downtrend broken
2. Retest of low
3. Break out above previous resistance
Result=trend now upwards
Check the example of a previous trade on RIO picture below.
Tech.
MACD is one of my favourite indicators. Actually I don't use indicators as my main tool, I still can't get a better reading than a classical and very conservative dow theory. I'm very old fashioned in that sense, I print my charts and I use pencil and ruler. But I've been studying indicators that feel to me clearly close to this kind of charting. I like very much a paragraph that Schwager writes in the new market wizards, (it's long, if you have it go to p.429). Basically it is something like: we're seeing the same, but through different instruments. When I like an indicator I enjoy finding the 'translations' between the indicator and my way of interpreting the market chart. It teaches me a lot. So I thought I'd share with you what I found about this one. Probably it's really obvious stuff, so forgive me if my contribution it's not very useful, but it's the kind of thing that once I understood I find 'beautiful'.
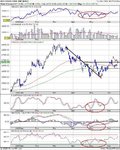
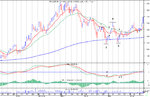
I'm posting the same chart, but I took it from metastock. I understand MACD as a special case of a big class of indicators, the 'price oscillator'. This consists of subtracting two moving averages, the fast and the slow. I don't know if you know about Raschke's system 'first-cross'. If you do, you'll notice that she uses a 'macd' with parameters 3 and 12 (I think). A price oscillator then is measuring the distance between these two moving averages. I'll take the case of a downtrend as an example, like in the rio chart posted by techst. So, to start we have a downtrend. This means fast ma below slow ma. If price changes down too fast, this is going to get reflected in the fast ma quite strongly compared to the slow ma, as the slow is making the average taking more periods, and for small swings that go more down than up you end up with the 'difference', that it went more down than up, but not the details of how it did it. During a trend we have secondary rallies and reactions, these appear in the fast ma. The slow ma is going to show the natural rallies and reactions (the grade of the reaction-rally will depend on which set of periods you choose). I'm looking now at what happens between points 1 and 2 of the chart. In point 1 of the chart we reached the top of the swing. The prices slows down, and before it starts going up we know that in normal market conditions is going to go down. The down swing starts. The fast ma moves quickly down following the price. This means, the distance between the fma and the sma increases. How much? A healthy much. It's not going to go down for ever. When the price goes back up, the fma takes this into account fairly quickly, and it first slows down starting to change direction, slows down and then starts going up. Now, what happens with the distance between the two ma's is clear from the chart. It starts to increase, it reaches a maximun, and then starts to decrease, (all this as a negative number because the slow ma is above the fast ma. In an up trend the same happens but in the positive side). So this translates in the macd as exactly that. Now, how do I translate a divergence? I'm looking now at the divergence techst signaled, this is, 2 and 5. In a price chart, the indication of a change of trend is a breaking of the pattern lower highs lower lows in a signficant way. This means, by the same kind of swings we're using to define the trend (same kind means same time scale I suppose). From the chart to me is clear that the swing 2-4-5 is something else. But, how does that 'something else' expresses itself in the language of the macd? The higher high 4 broke above the previous high 1, and it wasn't just a 'blip' of the chart, it was a proper swing that was built by consecutive bars going up. The fast ma now is including in the average bars that are higher than usual. So the distance between the fast ma and the slow ema, again goes from a minimun at the top of the swing (4) to a maximum at the bottom (5) of the swing. But now the absolute amount this distance changed it was smaller, because the fast ma is included this prices that are abnormally high compared to the previous swing, and to the other previous swings respect to each other. So this maximun separation distance that before was coming bigger and bigger or at worst staying the same, now is becoming smaller. So in the macd chart we're going to see a divergence appearing, and what it means is: this swing is different than the other, be alert.
Now about the signal line: I see the signal line of the macd just like an indication of 'curvature'. I hope I can explain my point. The signal line is a moving average of the macd line. So, it's an smoothing of this line, but it's basically the same line shifted that doesn't take into account the small blips. When the macd is going to turn, first slows down and then it starts to go up. The fast line reaches a minimum, and the ma is not there yet. If it is really a minimun, the macd (fast line) it's going to start going up, but the signal line doesn't know it yet, because it's averaging this only point with all the previous points. So the ma just keep going, and there you have the crossing, and that's the macd buy signal. (This is basically the same kind of thing that explains how dead and golden crosses work).
Now, I hope I didn't bore you too much, I just get into this stuff and I love it so much than I can't help talking and talking and talking! Well, anyway. After I understood this I found that I can choose very well different periods for the ma's and different periods for the signal line, and I know what that means and what I'm exactly generating by doing it. I also know when a signal is more of a false signal, and I can even see signals that would be there if I was using a tiny faster signal line but they don't show in my choice of ma's. I also can see how some signal can be generated and shouldn't be taken into account. I think it is a powerful tool. I still find it easier to look at the chart, but macd reinforces what I see.
So, sorry again if this is most basic for all of you, I think is worth posting because it wasn't obvious to me, may be someone else can benefit from this. And I can't shut up when I discover something, even if it is something that most people knew from the beginning of times!!!
Have a nice weekend guys,
Silvia.
Being a trader IS a solitary pursuit, can you imagine how happy I am of being able to discuss these things with you guys??? I can't discuss this stuff with anyone I know!