Stan Weinstein's Stage Analysis

The following stocks that have been mentioned here have all come back to their B.O. levels.

XXIA
F
RIMM

Owing to the volume characteristics I'm seeing these as potential failures. I have been long RIMM since the break out with a stop under the 50dma, any thoughts?

Cheers

I wouldn't characterise Ford as a potential failure just yet personally, as it's simply making it's first significant pullback after it's initial Stage 2A breakout in early December and is currently still above it's early 2012 resistance, which will now become support. So what you should be looking for here imo, is signs that the support is holding over the coming days/weeks, as the volume on the decline, except for today (which was related to strong earnings results - sell the news scenario) has been relatively weak, and if you look at P&F cumulative volume of the decline, it's be very small in comparison to the up volume during the breakout - which is a positive sign. So I think it should stay on the watchlist, as it had gotten overextended in the short term and a correction is healthy and what we were looking for, and the 30 week MA is rising and a long way below still, and the relative performance is still above it's zero line.
 

Attachments

  • F_Weekly_29-1-13.png
    F_Weekly_29-1-13.png
    32.6 KB · Views: 594
  • F_Daily_29-1-13.png
    F_Daily_29-1-13.png
    24.4 KB · Views: 292
  • F_PnF_29-1-13.png
    F_PnF_29-1-13.png
    15.9 KB · Views: 283
  • F_PnF2_29-1-13.png
    F_PnF2_29-1-13.png
    15.8 KB · Views: 289
Last edited:
RIMM is a slightly different story than Ford though imo, as it's base was very small in comparison, plus it's given a double bottom sell signal on it's short term P&F chart. Volume again isn't too terrible and may be due to trimming as the stock has run nearly a few hundred percent in the last six months or so. But it hasn't done anything seriously wrong yet in regards to the method, and is still well above it's 50 day MA, so it's probably going to be a volatile ride.

With regards to raising your stop loss read chapter 6, pages 184 for the investor stop and 194 for the traders stop as it explains it a lot better than I can. But if you are under the 50 day MA currently then you're in the right place imo, as there's no recent swing low or trend line to place it under yet as the January continuation breakout was parabolic. So it needs to form a new swing low before you consider moving it higher imo.
 

Attachments

  • RIMM_Weekly_29-1-13.png
    RIMM_Weekly_29-1-13.png
    23.3 KB · Views: 269
  • RIMM_Daily_29-1-13.png
    RIMM_Daily_29-1-13.png
    25.9 KB · Views: 270
  • RIMM_PnF1_29-1-13.png
    RIMM_PnF1_29-1-13.png
    23.9 KB · Views: 284
  • RIMM_PnF_29-1-13.png
    RIMM_PnF_29-1-13.png
    18.9 KB · Views: 291
RiMM, I was n't sure about where the method advocates to place the stop loss(trader) and it was a bit of a hasty decision to get in. I was late getting on to my computer and thought about your volatility SL but it was approaching the US close so it was easier to quickly calculate my position size using the 50 dma. I understand that many of the big players use it for decision making. I always place my stop a little lower to allow for stop hunting. Thanks for you input, the book has a permanent place on my desk now.

FITB has also come back to the BO level, possible trader buy with plenty of upside, it's also in the strongest sector, financials.

I took a short position in Petsmart in my Sbetting account just before the close.
 
Last edited:
Perrigo Co (PRGO)

I'm highlighting another Stage 4 breakdown tonight as I think it's interesting to look at stocks that are breaking down when the market is so strong, as it means that they are particularly weak. Tonight's watchlist pick is PRGO - Perrigo Co which broke down into Stage 4A back in early November and has since tried to rally back above it's 30 week MA, but never made it and has rolled over today to break down below it's swing low from the November drop. Most of the usual elements like weak relative performance versus the S&P 500 and it's sector are in place. And the 30 week MA is declining and the large players have been selling. But my major concern however is that it moved up in a very volatile fashion and so has a fair amount of support below, as can be seen particularly well on the P&F chart. So it's not my favourite on the short watchlist currently, but it has got some potential if it can close the week below 100.
 

Attachments

  • SharpChartv05-6.png
    SharpChartv05-6.png
    29.6 KB · Views: 271
  • sc-7.png
    sc-7.png
    43 KB · Views: 290
  • sc-6.png
    sc-6.png
    30.5 KB · Views: 286
As I recall the interview with Stan he was trying to jump the gun and say that in his experience this sort of price action was a prelude to a top. As I have said before, although the book mentions that H&S, etc. are sometimes seen in a top, seeing a pattern is merely a bonus and the key feature of a top is the 30wk turn down and the volume horizontal breakdown or occasionally uptrend line break.
Using any old software to look at a currency pair, I see GBPUSD broke down last week and the 30wk MA would have started turning down. This week it retests the breakdown level around 1.5850 area. If Weinstein works for currencies, then it should have a bit of a move down 400 pips or so.
$XBP - SharpCharts Workbench - StockCharts.com

One thing to note on that one, is that GBPUSD is in a multi-year Stage 1 on the monthly charts, and your target would put it below it's 4 year trendline.

I personally think that monthly charts are more usable with currencies for the method, because of the technical nature of the participants in that market.

attachment.php
 

Attachments

  • GBP_Monthly_31-1-13.png
    GBP_Monthly_31-1-13.png
    31.8 KB · Views: 1,297
Looks like we may get a candlestick reversal pattern around the BO level out of Ford today on the daily. Foster Wheeler also but would have liked to have seen some enthusiasm/volume for both the stocks, still over two hours until the close though.

EDIT: Opportunity to short US long bond, I'm in with TBT, TLT chart added.
 

Attachments

  • Ford Daily.jpg
    Ford Daily.jpg
    74.8 KB · Views: 269
  • FWLT Daily.jpg
    FWLT Daily.jpg
    81.6 KB · Views: 275
  • TLT Weekly.jpg
    TLT Weekly.jpg
    94.1 KB · Views: 289
Last edited:
. . . I personally think that monthly charts are more usable with currencies for the method, because of the technical nature of the participants in that market. . . .
Thanks for your view. I don't really like to mess around too much with the basic method, and I think the weekly set up was as good as you are likely to get with a weekly approach to currencies, with a good retest so you could enter well above 1.58, offering a 50-100 point stop, and no recent support until 1.53.
Sketch using ADVFN wkly since 1.53 low. (ADVFN charts never look quite accurate)
The Euro and stockmarkets rose, so I guess that by chance there is something in the wind for the GBP; you're not usually so lucky !
 
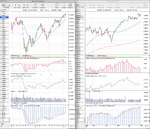
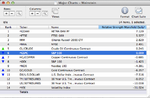
Attached is the updated major charts and the relative performance table. I've added in some additional Index charts from Europe this week, as the short selling ban was lifted in Greece and Spain during the week ,so I thought it would be interesting to see how they are progressing in their Stage 2 runs.

Also, as usual I've updated the market breadth charts, so that we can see what the weight of evidence is currently suggesting: http://www.trade2win.com/boards/technical-analysis/147476-market-breadth-25.html#post2066248

attachment.php


Notes:

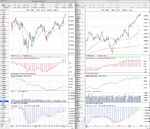
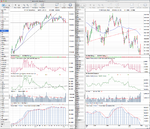
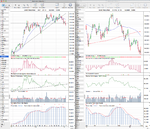
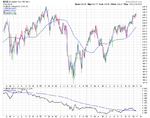
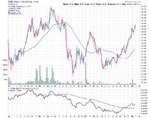
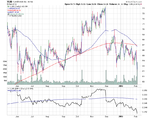
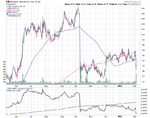
The Shanghai Composite (SSEC) broke above it's downtrend line fairly convincingly and so should be considered in early Stage 2 now. However, it's rapidly approaching it's two previous major swing highs from early 2012 in the upper 2400s and another from 2011 at 2536 and so it could meet further resistance in that zone.

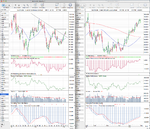
The Greece, Italy and Spain charts all had a reversal this week. They are in Stage 2 but came under pressure from the lifting if the short selling ban.

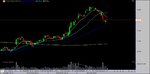
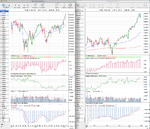
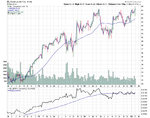
US stock indexes all continued higher after a week of heavy data. Negative GDP was virtually ignored, and the markets continued higher on Friday's following strong revisions to the previous months jobs data. All the major indexes are now in Stage 2 again including the lagging Nasdaq 100, which has been held back by Apple's weighting in the index.

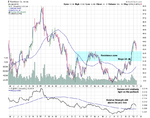
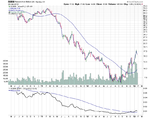
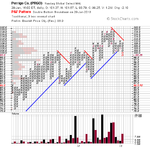
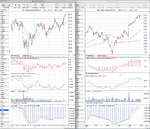
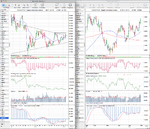
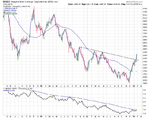
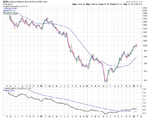
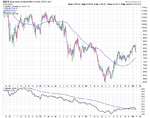
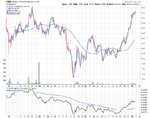
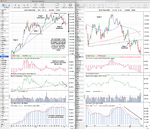
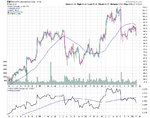
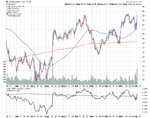
The Dollar Index (DX) continues to attempt a continuation move in Stage 4B, and is very close to the horizontal breakdown level. There is a head and shoulders pattern on the daily and weekly charts, and it looks to be setting up the breakdown further below the major resistance from the relative performance and the cumulative volume. But the support could still hold yet, as it has done many times previously.

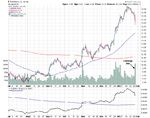
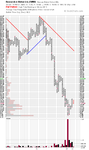
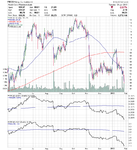
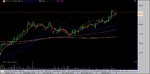
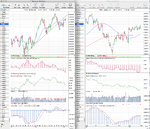
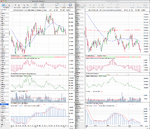
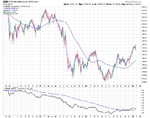
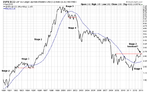
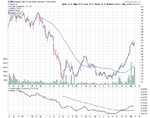
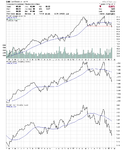
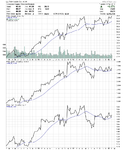
US Treasuries have broken down convincingly into Stage 4 now and saw a volume pickup this week, especially on Friday as they surged higher immediately following the jobs numbers as people tried to bottom pick at the headline 2% yield level. This was short lived though as they fell back just as strongly to close the week at a new 52-week closing low. I've revised my swing targets to 127.80 on the 10 year and 136.69 on the 30 year.

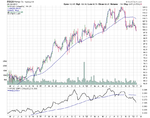
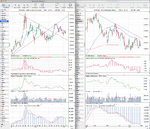
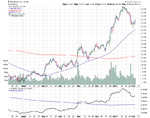
Crude Oil (CL) managed to get back above it's zero line this week which is highlighted on the relative performance table with the green arrow, and looks to be targeting the next resistance at the 100 level.

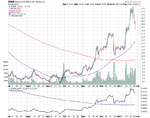
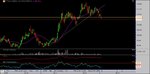
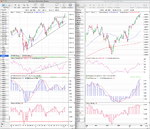
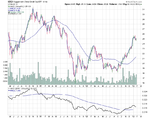
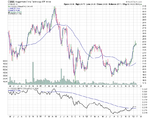
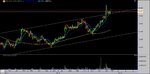
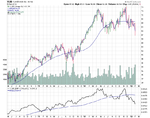
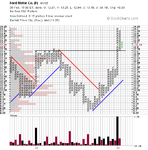
I spoke on last weeks update about Copper (HG) beginning to interest me due to the increasingly squeezed price action within the Stage 1 range. This was resolved this week with a breakout close above the downtrend line. It still has near term resistance to clear, but I consider it a decent trader entry point as it's now in Stage 1B and has around 3x ATR(200) risk to the stop position below the recent swing low. So I'll be looking for an entry point at the beginning of the week.

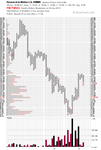
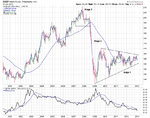
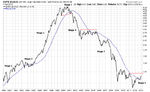
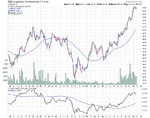
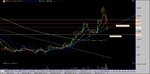
Gold (GC) is another chart showing a squeeze in the price action and has been trading around the flat 200 day MA since mid December. I consider it in Stage 1- as it's in a short term downtrend within it's Stage 1 range and briefly made a Stage 4 breakdown before reversing quickly the same day back up into the Stage 1 range. I took a speculative long position in Gold last week as the Palladium trade I took on 21st January is working out well so far in it's early Stage 2 run, and is strongly correlated to Gold. So due to being able to have a tight stop below the recent range, I thought it was worth the additional risk on top of the palladium trade.
 

Attachments

  • DAX_Weekly_1_2_13.png
    DAX_Weekly_1_2_13.png
    135.1 KB · Views: 304
  • NYA_Weekly_1_2_13.png
    NYA_Weekly_1_2_13.png
    132.5 KB · Views: 326
  • IWM_Weekly_1_2_13.png
    IWM_Weekly_1_2_13.png
    125.4 KB · Views: 321
  • NDX_Weekly_1_2_13.png
    NDX_Weekly_1_2_13.png
    137.8 KB · Views: 310
  • SPX_Weekly_1-2-13.png
    SPX_Weekly_1-2-13.png
    145.8 KB · Views: 366
  • TY_10yr_Treasuries_1_2_13.png
    TY_10yr_Treasuries_1_2_13.png
    134.8 KB · Views: 304
  • CL_Weekly_1_2_13.png
    CL_Weekly_1_2_13.png
    137.1 KB · Views: 334
  • HG_Weekly_1_2_13.png
    HG_Weekly_1_2_13.png
    137.9 KB · Views: 326
  • GC_Weekly_1_2_13.png
    GC_Weekly_1_2_13.png
    136 KB · Views: 342
  • FTSE100_Weekly_1_2_13.png
    FTSE100_Weekly_1_2_13.png
    138.3 KB · Views: 305
  • US_30yr_Treasuries_1_2_13.png
    US_30yr_Treasuries_1_2_13.png
    132.8 KB · Views: 313
  • DX_Weekly_1_2_13.png
    DX_Weekly_1_2_13.png
    132.9 KB · Views: 296
  • SSEC_Weekly_1-2-13.png
    SSEC_Weekly_1-2-13.png
    28.2 KB · Views: 315
  • Major_Charts_RS_list_1_2_13.png
    Major_Charts_RS_list_1_2_13.png
    25.3 KB · Views: 1,264
  • EUR100_Weekly_1-2-13.png
    EUR100_Weekly_1-2-13.png
    34.3 KB · Views: 294
  • ATG_Weekly_1-2-13.png
    ATG_Weekly_1-2-13.png
    24.6 KB · Views: 313
  • MIB_Weekly_1-2-13.png
    MIB_Weekly_1-2-13.png
    31 KB · Views: 289
  • IBEX_Weekly_1-2-13.png
    IBEX_Weekly_1-2-13.png
    31.2 KB · Views: 317
Last edited:
The following stocks that have been mentioned here have all come back to their B.O. levels.

XXIA
F
RIMM

Owing to the volume characteristics I'm seeing these as potential failures. . .
GoodTyne yes I think you are right on XXIA. There is a lesson here for me to check the longer term chart, as there is $20 resistance in 2005, which I had not noticed. 10yr weekly chart Ixia, XXIA BigCharts.com
If over the two or three weeks following a breakout a chosen stock does not behave itself, and drifts back below its breakout level, then I think it is safer to put it out of its misery way ahead of any stop we may have set, even if it stays on watchlist for a more convincing breakout.
 
Stocks versus Commodities Long Term Ratios

I came across a long term chart of the Commodities to Stocks ratio today and thought it was a very interesting chart. So I've given it the stage analysis treatment but used a monthly chart and 30 month SMA to give a longer term perspective to the Stages. And I've also done the same with the S&P 500 / Gold Ratio.

What it shows is that stocks have been in Stage 4 versus commodities and gold for the last 12 years or so, but are now beginning to move through Stage 1, and in commodities case they have given a potential Stage 2 breakout. So this is a chart I'm going to keep an eye on, as it's indicating a longer term shift back to stocks could be beginning, of which the last Stage 2 for stocks lasted around 20 years between 1980 and 2000 with only a few short breakdowns like in 1987. So is very interesting to me...

attachment.php


attachment.php
 

Attachments

  • SPX_CCI_Ratio_1_2_13.png
    SPX_CCI_Ratio_1_2_13.png
    21.4 KB · Views: 1,339
  • SPX_Gold_Ratio_1_2_13.png
    SPX_Gold_Ratio_1_2_13.png
    21.6 KB · Views: 1,370
Last edited:
China

With the Shanghai Composite (SSEC) moving into Stage 2 last week, I thought it would be interesting to post the China ETFs that are showing the most relative strength versus the market. Note the excellent increase in volumes following the Stage 2 breakouts on the Guggenheim China Real Estate ETF (TAO) and the iShares MSCI China Small Cap Index Fund (ECNS). All are extended short term, but have been consolidating their gains over the last month.
 

Attachments

  • sc-21.png
    sc-21.png
    31.3 KB · Views: 304
  • sc-20.png
    sc-20.png
    31.9 KB · Views: 305
  • sc-19.png
    sc-19.png
    27.7 KB · Views: 311
  • sc-18.png
    sc-18.png
    33.4 KB · Views: 313
  • sc-17.png
    sc-17.png
    32.6 KB · Views: 322
  • sc-22.png
    sc-22.png
    34.6 KB · Views: 304
Last edited:
US Treasuries Stage Analysis

It's been five months since my last full Stage analysis of the US 30 year Treasuries chart when I noted that the 30 year Treasuries had entered into Stage 3A here: http://www.trade2win.com/boards/technical-analysis/134944-stan-weinsteins-stage-analysis-67.html#post1967674. However, this week saw the confirmation of the initial Stage 4 breakdown that has been developing over the last month and so completes the major Stage 3 top, giving me a new initial swing target of 136.69

Relative performance is weakening well below the zero line and cumulative volume shows that volume has been leaving Treasuries since early December. The 30 week weighted MA has been negative for 8 weeks and the simple 30 week MA has been moving lower also.

Risk on a traders entry stop loss is around 3.82 x ATR(200) from Fridays closing price and 5.53 x ATR(200) to the swing target from there, so to get a minimum 2/1 risk reward you'd want to aim for an entry point under 3 x ATR(200) risk, as that would then give you over 6 x ATR(200) reward and hence the minimum 2/1 risk reward. So you'd be looking for a short entry on a pullback above 143.75 on the March 2013 Futures contract,

Note: Weinstein mentioned in one of the interviews that he aims for at least 3/1 risk reward, but I think he was talking about the longer investor positions, and so a minimum of 2/1 for short term trader positions seems sensible imo. But if you can get 3/1 then even better.
 

Attachments

  • US_30yr_Treasuries_1_2_13.png
    US_30yr_Treasuries_1_2_13.png
    142.2 KB · Views: 312
Last edited:
GoodTyne yes I think you are right on XXIA. There is a lesson here for me to check the longer term chart, as there is $20 resistance in 2005, which I had not noticed. 10yr weekly chart Ixia, XXIA BigCharts.com
If over the two or three weeks following a breakout a chosen stock does not behave itself, and drifts back below its breakout level, then I think it is safer to put it out of its misery way ahead of any stop we may have set, even if it stays on watchlist for a more convincing breakout.

If I recall correctly, Weinstein advises that support and resistance levels that occurred over two years ago are not significant and can therefore be safely ignored. I think the sell off after the break out may just be a reaction to the resistance at the last high in Feb 2011. It has now closed above the BO level and has found support on the upper channel line on the daily. In view of the two year rule I am mindful that there are no sellers up above so I will be watching it this coming week.

I have a very small position in RIMM, which looks quite sick but has respected the trend line and 50 dma so I will also be watching the price action this week. I would have been out had a observed the 6% below BO rule so my bad.

I am not in Ford butwill be watching next week. If I see price to be above Fridays high near the close tomorrow on good volume then I'll probably go in.

ISA, great analysis again this week and especially the revealing long term charts of commodities and gold vs SPX. Could prove to be the start of a significant trend in stocks. The ducks appear to be lining up with Treasuries dropping into a stage 4. Nice to see some A+'s RE: the China ETF's!
 

Attachments

  • XXIA Daily.jpg
    XXIA Daily.jpg
    85 KB · Views: 308
  • RIMM - Daily.jpg
    RIMM - Daily.jpg
    92.1 KB · Views: 307
Last edited:
This is what you could of won - Jim Bowan of Bulls Eye :)

Shame we missed this one guys.
 

Attachments

  • FXY - Yen.jpg
    FXY - Yen.jpg
    76.4 KB · Views: 327
Hi Isatrader,

I have a cheeky favour to ask if you can do one of your SW Stage Analysis on Research In Motion RIMM the new BlackBerry please.

I have already bought into it but just wondering what your analysis might say.


Many thanks in anticipation (y)
 
Last edited:
Hi Isatrader,

I have a cheeky favour to ask if you can do one of your SW Stage Analysis on Research In Motion RIMM the new BlackBerry.

I have already bought into it but just wondering what your analysis might say.


Many thanks in anticipation (y)

Hi Atilla, I have done a chart markup so you can see where I'm at with the Stages etc, and should be fairly clear from it. Currently BBRY is in Stage 2, and the recent swing low has given an opportunity to raise the trader stop loss to around 11.38 imo, although it's a little early to raise the stop loss, as you shouldn't really raise it until the swing high has been broken, but due to the percentage moves in this I think it's acceptable on this occasion.

Relative performance versus the S&P 500 is positive and volume has had a significant pickup through the initial Stage 2 run. The recent sharp pullback volume looked big on a weekly bar, but it only made a small dent in the weekly cumulative volume, which remains above it's moving average. So if you are in it, then Weinstein's method has it as a "hold" in Stage 2 imo.

As a note the Stage 2A breakout point could be questioned as the 30 week SMA was only just turning from down to flat. So it was a more aggressive Stage 2A than most, and could have been considered as a breakout into a larger Stage 1 range imo. So the alternate 2A breakout point would have been the 11th Dec when it broke above it's swing high that formed above the 200 day MA.
 

Attachments

  • RIMM_Weekly_5-2-13.png
    RIMM_Weekly_5-2-13.png
    127 KB · Views: 367
Last edited:
Hi Atilla, I have done a chart markup so you can see where I'm at with the Stages etc, and should be fairly clear from it. Currently BBRY is in Stage 2, and the recent swing low has given an opportunity to raise the trader stop loss to around 11.38 imo, although it's a little early to raise the stop loss, as you shouldn't really raise it until the swing high has been broken, but due to the percentage moves in this I think it's acceptable on this occasion.

Relative performance versus the S&P 500 is positive and volume has had a significant pickup through the initial Stage 2 run. The recent sharp pullback volume looked big on a weekly bar, but it only made a small dent in the weekly cumulative volume, which remains above it's moving average. So if you are in it, then Weinstein's method has it as a "hold" in Stage 2 imo.

As a note the Stage 2A breakout point could be questioned as the 30 week SMA was only just turning from down to flat. So it was a more aggressive Stage 2A than most, and could have been considered as a breakout into a larger Stage 1 range imo. So the alternate 2A breakout point would have been the 11th Dec when it broke above it's swing high that formed above the 200 day MA.


Much obliged thank you Isatrader,

I love the clarity and concise explanation of your charts. I'll stay in until $30s and may take half off after March / April and let the rest run. As for my stop I had 10.70 in mind but probably after recent rally 11.70-80 sounds better.

Best regards,

Atilla
 
Watchlist

Here's a few of today's breakdowns and a potential breakout to new highs in the S&P 500. I think YUM has the best potential to breakdown imo, as it is showing a H&S pattern, as can be seen clearly on the weekly relative performance chart, and it's under performing the S&P 500 at only 13th from bottom in the RS table. It's also under performing it's sector as well by a long way.

So some stocks for consideration this week, if they close below or above their relevant breakdown or breakout levels.

P.S. Also I noticed Ford (F) has stabilised a bit, and is forming a potential swing low. I'm looking for a close tomorrow above today's high to complete the swing low imo, and would give a tight stop position (around 2 to 3 x ATR) for a potential pullback entry. See the daily and P&F charts attached. The P&F chart shows how the support identified from the early 2012 highs has held up so far.
 

Attachments

  • EW_RS_Weekly_5-2-13.png
    EW_RS_Weekly_5-2-13.png
    48.6 KB · Views: 333
  • EW_Weekly_5-2-13.png
    EW_Weekly_5-2-13.png
    33.2 KB · Views: 329
  • YUM_Daily_5-2-13.png
    YUM_Daily_5-2-13.png
    38.3 KB · Views: 341
  • YUM_RS_Weekly_5-2-13.png
    YUM_RS_Weekly_5-2-13.png
    37.6 KB · Views: 328
  • YUM_Weekly_5-2-13.png
    YUM_Weekly_5-2-13.png
    30.2 KB · Views: 342
  • EW_Daily_5-2-13.png
    EW_Daily_5-2-13.png
    34.6 KB · Views: 324
  • EL_Weekly_5-2-13.png
    EL_Weekly_5-2-13.png
    30.6 KB · Views: 328
  • EL_RS_Weekly_5-2-13.png.png
    EL_RS_Weekly_5-2-13.png.png
    44.7 KB · Views: 290
  • EL_Daily_5-2-13.png
    EL_Daily_5-2-13.png
    36.7 KB · Views: 310
  • sc-34.png
    sc-34.png
    27.3 KB · Views: 306
  • F_PnF_5-2-13.png
    F_PnF_5-2-13.png
    15.4 KB · Views: 351
Last edited:
Top