You are using an out of date browser. It may not display this or other websites correctly.
You should upgrade or use an alternative browser.
You should upgrade or use an alternative browser.
isatrader
Senior member
- Messages
- 2,965
- Likes
- 136
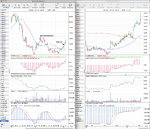
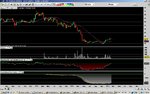
Hi Routy, attached is the updated charts including today's data. I agree with lplate that OCDO is interesting as well. However, the reason I'd put it as second is that it still has near term resistance to work through, whereas LWB has mostly cleared it's resistance and has a better volume profile. Both are in early Stage 2 and extended in the short term, so you'd be wise to look for a pullback entry on both, which it explains in the book or a traders entry on a continuation move once they consolidate.
I'm signing off now until next week as I'm going away for the weekend. So I'll leave it to other members to answer any other questions until then.
I'm signing off now until next week as I'm going away for the weekend. So I'll leave it to other members to answer any other questions until then.
Attachments
goodtyneguy
Active member
- Messages
- 146
- Likes
- 9
isatrader
Senior member
- Messages
- 2,965
- Likes
- 136
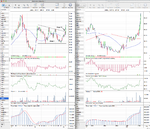
Man Group (EMG.L)
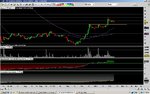
Just before I leave for my trip in a minute, here's one for the watchlist today that's in Stage 1B testing the Stage 2A breakout level. Good risk setup with just over 3 x ATR stop loss position and an initial swing target to 126.20 which is over 8 x ATR. Next resistance if the Stage 2 breakout is made is the March 2012 swing high at 152.80
Relative performance is improving well, and has been above the zero line on the daily since the start of the year and volume is around average.
Attachments
CUP.L,UK:CUP breakdown
Ocado OCDO awful fundamentals but chart with positive potential.
Cupid CUP good fundamentals, trading statement, possible takeover, but awful chart. £125m global online-dating company only listed for 2 years, but Weinstein method warns. Cupid sketch chart from ADVFN
Have a well-deserved rest isatrader !
goodtyneguy
Active member
- Messages
- 146
- Likes
- 9
isatrader
Senior member
- Messages
- 2,965
- Likes
- 136
Ocado doing well (just broken 12 month high) - is it best to wait to see if this finishes above this into the close and buy 50% then or wait a few days and see if there's a pullback?
Hi Routy, I only just got back tonight from Venice as was delayed at the airport, so am sorry for the slow reply on this one.
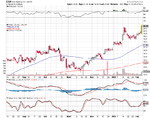
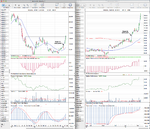
As I said the other day OCDO has moved quite far above it's Stage 2 breakout point and so following the method you've missed the ideal entry point on this one and also potentially the secondary B entry point as it had a small consolidation and pullback in late January and has now moved well clear of the early Stage 2 buying zone, but has showed excellent strength by closing above the 134 zone resistance and looks to have momentum.
Today's close has given a potential much longer term Stage 2 breakout if you look at the monthly charts. But in the shorter term you don't have an entry point in this until it next consolidates imo, as it's 44% above the weekly Stage 2A breakout point in less than a month. And so you have no swing low close enough for a reasonable risk reward setup, and would be chasing it if you entered here imo. So longer term it's shaping up well, but short term it's way above it's Stage 2A entry point and also it's most recent swing low, and so as I said before, all you can do is wait for a significant pullback within the Stage 2 uptrend as you've missed the entry point - and that doesn't mean a few days. It would be a multi week pullback and turn higher again to give you a trader entry point with a more reasonable risk reward setup.
It's frustrating to watch stocks run away from you, but when it happens you shouldn't chase. Just be happy that you've picked a good stock and are on the right track in terms of what you are looking for, and put it on the watchlist to potentially enter on it's next significant pullback or consolidation period.
I don't want to give you investment advice as I'm not qualified to, and am still learning myself. All I can tell you is how it looks with regards to Weinstein's method which hopefully I've done clearly above.
Attachments
Hi
Hope you had a great trip.
Fantastic advice - I didn't buy OCDO yesterday - will wait and see what happens on the pullback.
I did however buy a small amount of EMG just before close as broke resistance on high volume.
Any thoughts on this one?
I've also got LWB on my watchlist - looking at any pullback.
Thanks
isatrader
Senior member
- Messages
- 2,965
- Likes
- 136
I did however buy a small amount of EMG just before close as broke resistance on high volume.
Any thoughts on this one?
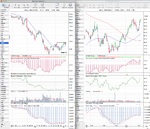
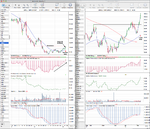
I have the Stage 2A breakout point as 100.80 on Mondays close, so you would have done well to buy close to that level. It's broke up quickly and is now testing the resistance zone from late 2011 / early 2012, and so that could hold it back, but it is fairly light resistance as there wasn't a lot of volume exchanged there. So it is more of technical level.
As I said previously the initial swing target is 126.20 and I've marked on the charts the trader and investor stop positions as I see them, so all you can do now that you are in it is to set your stop loss and monitor it. But you don't need to watch it too closely. With Weinstein's method, once a day is enough in my opinion as that stops you interfering with the trade. And if it's an investor position then once a week will do. Good luck with it.
Attachments
isatrader
Senior member
- Messages
- 2,965
- Likes
- 136
Hi
Thanks very much for such a full answer!
Do you have any more UK stocks on your watch list?
All the best
Richard
Hi Richard, I don't focus much on the UK stocks, but there is a service that does a monthly guide of the stages of the UK stocks called Sharehunter. It's a paid service, but he does offer a free sample of the latest stages guide if you ask, which would give you a watchlist of the FTSE 350 stocks. Here's the link: www.sharehunter.com/portfolio.php
isatrader
Senior member
- Messages
- 2,965
- Likes
- 136
Hi
Thanks again.
I'll check sharehunter out - have you tried it?
I've also just set up an international share account through barclays so will be able to trade us stocks...
Thanks
Routy
A long time ago when I was first learning the method as I wanted to see if he was making pure Weinstein picks and how they compared to my own. I found it to be on a similar track but with their own personalisations as you would expect. But I didn't continue past the trial period as I wanted to study Weinstein's method for myself to really understand it - which this whole thread has been about.
As I've said before, everyone has their own path and different time constraints. There are plenty of free resources that will help you do it yourself, but if you after a picks service then sharehunter is the only option for UK Weinstein method picks. Hope that helps.
M
malaguti
ISA, apologies to post off topic, but I see you are using Pro TA for charting. How do you find their P&F charts?
Thanks
Thanks
isatrader
Senior member
- Messages
- 2,965
- Likes
- 136
ISA, apologies to post off topic, but I see you are using Pro TA for charting. How do you find their P&F charts?
Thanks
There's a number of problems with them unfortunately, in that they don't plot the Xs and Os correctly as a normal P&F chart would. For example, you get more columns than you should do as on the high low based charts as it doesn't follow the basic rules for creating the charts, and so are only accurate on a closing basis only. I still find it useful from time to time, but if you want proper P&F then it's not the tool to use.
I've found ProRealTime isn't too bad for end of day P&F charts and plots them correctly. So is another P&F option and is free for just end of day use.
M
malaguti
There's a number of problems with them unfortunately, in that they don't plot the Xs and Os correctly as a normal P&F chart would. For example, you get more columns than you should do as on the high low based charts as it doesn't follow the basic rules for creating the charts, and so are only accurate on a closing basis only. I still find it useful from time to time, but if you want proper P&F then it's not the tool to use.
I've found ProRealTime isn't too bad for end of day P&F charts and plots them correctly. So is another P&F option and is free for just end of day use.
thanks ISA
Hello ISA and fellow traders, I am a newbie. I have read and re-read Stan Weinstein's book over and over. I have paper traded for last 5 months and after doing relatively well I finally started trading with the green stuff.
I have been following this thread for sometime now and it has been very useful.
I know you have mentioned earlier that volume increase at the time of the breakout is not important. But we should see increased volume after the breakout and the pullback should be on low volume.
I bought AET recently and as of today (2/13) it has not shown any volume increase and seems like its going to close lower second time in three weeks. What do you think about that. How should I analyse such situations.
Any help would be greatly appreciated.
Similar threads
- Replies
- 2
- Views
- 5K
- Replies
- 170
- Views
- 31K
- Replies
- 9
- Views
- 17K
- Replies
- 0
- Views
- 2K