isatrader
Senior member
- Messages
- 2,965
- Likes
- 136
Hello ISA and fellow traders, I am a newbie. I have read and re-read Stan Weinstein's book over and over. I have paper traded for last 5 months and after doing relatively well I finally started trading with the green stuff.
I have been following this thread for sometime now and it has been very useful.
I know you have mentioned earlier that volume increase at the time of the breakout is not important. But we should see increased volume after the breakout and the pullback should be on low volume.
I bought AET recently and as of today (2/13) it has not shown any volume increase and seems like its going to close lower second time in three weeks. What do you think about that. How should I analyse such situations.
Any help would be greatly appreciated.
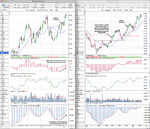
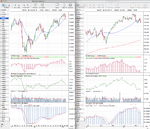
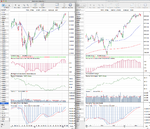
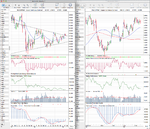
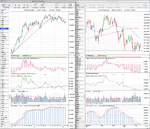
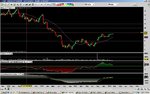
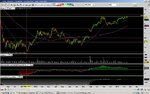
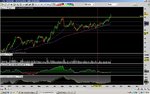
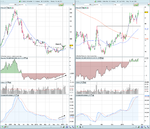
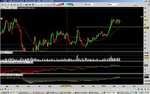
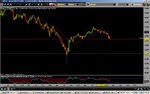
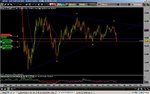
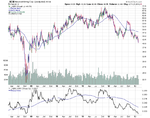
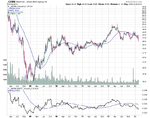
Hi anupam384, thanks for posting for the first time on here. I've had a look at the AET chart and marked it up as I see it. I've got the Stage 2 breakout point as the close above the swing high on the 12/12/12 at 45.91
The volume wasn't great on the daily when it broke out. Less than twice the average, which is quite low, as the target volume on the breakout day is for at least three times the average and twice the average on the weekly chart if I remember correctly. The cumulative volume however has been building and has stayed above it's weekly moving average since September.
Relative performance versus the S&P 500 has been reasonable though and it's slightly outperformed since the breakout point, and has stayed above it's zero line.
It's now reached it's first major point of resistance since the Stage 2 breakout, which is the March 2012 high at 51.14 and saw a pullback from it after getting close on Tuesday at 51.10, so a pullback here would be very normal, as it's a natural point for people to take profits as there will be a lot of targets here, and for some selling to come in with people trying to gamble that it will a top. But with regards to the method other than the volume issue it hasn't done much else wrong yet. So you could take some profits as Weinstein says not to hold onto a stock if it doesn't see a pickup in volume following the breakout and AET has actually had lower than average volume since the breakout, which isn't a good sign. It doesn't mean it couldn't breakout further though, but as far the method is concerned it's a average C- stock, and so you need to decide whether to let it play out until it hits your trailing stop loss, or to move on to something else.
When to sell is the hard part of the process and I've made many mistakes myself over the last few years and sold positions too early that are still grinding higher in Stage 2 on low volume to this day. So it's always a judgement call at this point that never seems to get any easier. Good luck with it.