Stan Weinstein's Stage Analysis

UK FTSE 350 Sectors

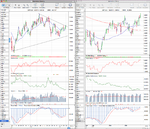
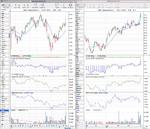
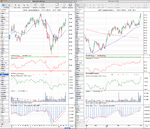
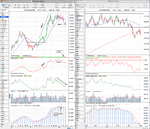
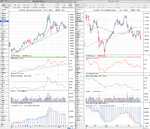
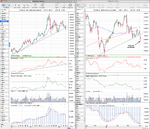
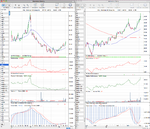
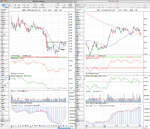
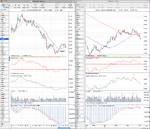
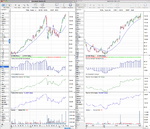
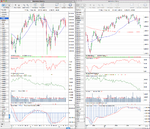
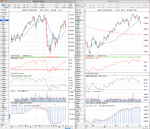
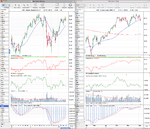
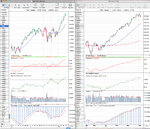
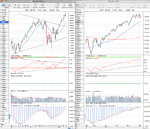
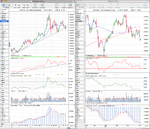
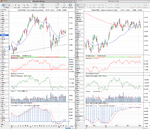
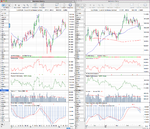
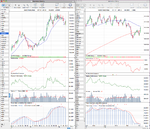
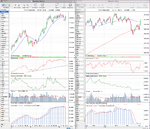
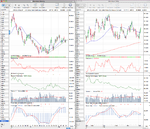
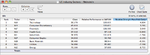
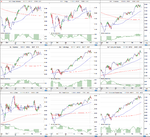
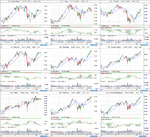
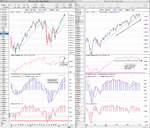
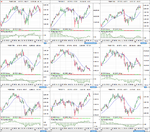
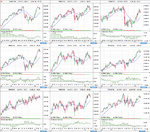
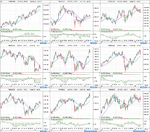
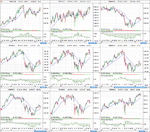
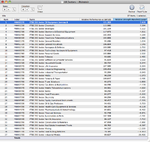
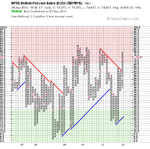
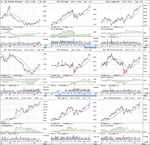
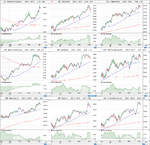
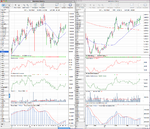
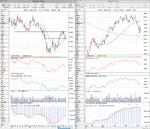
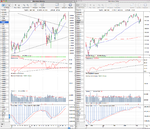
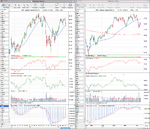
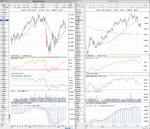
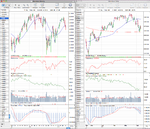
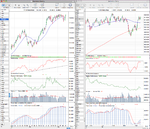
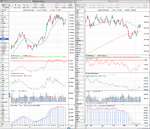
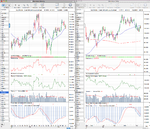
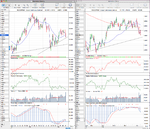
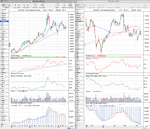
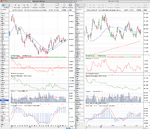
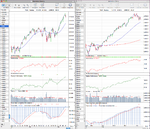
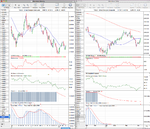
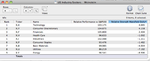
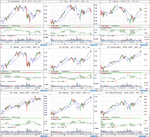
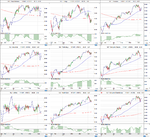
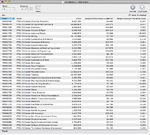
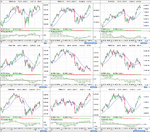
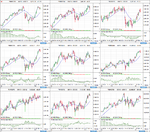
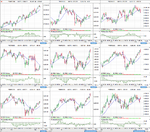
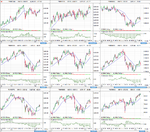
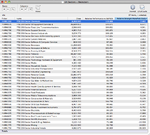
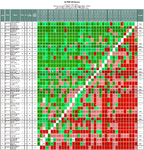
Attached is the updated UK FTSE 350 sector charts and relative strength lists. Using the Mansfield RS as the gauge of strength, NMX1350 Chemicals comes out on top. But I've also included the FTSE 350 sector matrix which shows the peer relationships and how each sector is doing relative to the other sectors. It's ranked by the strongest to the weakest, so NMX2750 Industrial Engineering is the current strongest sector, but it weakened against 6 sectors on Friday and it's combination score is significantly weaker than the other top 5 sectors, so NMX1350 Chemicals again looks to be the strongest sector based on it's combination score of short and long term signals.
 

Attachments

  • UK_Sectors_list_30_3_12.png
    UK_Sectors_list_30_3_12.png
    83.7 KB · Views: 348
  • UK_Sectors_1_30_3_12.png
    UK_Sectors_1_30_3_12.png
    105.3 KB · Views: 296
  • UK_Sectors_2_30_3_12.png
    UK_Sectors_2_30_3_12.png
    105.2 KB · Views: 281
  • UK_Sectors_3_30_3_12.png
    UK_Sectors_3_30_3_12.png
    107.1 KB · Views: 329
  • UK_Sectors_4_30_3_12.png
    UK_Sectors_4_30_3_12.png
    103.9 KB · Views: 318
  • UK_Sectors_RS_list_39_3_12.png
    UK_Sectors_RS_list_39_3_12.png
    83.8 KB · Views: 279
  • FTSE350-Sectors-M_30-3-12.png
    FTSE350-Sectors-M_30-3-12.png
    142.1 KB · Views: 601
GBP/USD is in Stage 1B and very close to a potential Stage 2A breakout. I think a daily close above 1.60 would be the Stage 2A breakout imo.

Following the note last week that GBP/USD was in Stage 1B, it made a breakout above 1.60 on Friday and managed to close the day above that level. So I consider it a Stage 2A breakout and went long on Friday with a buy-stop order at 1.60211

Here's the chart
 

Attachments

  • GBPUSD_weekly_30_3_12.png
    GBPUSD_weekly_30_3_12.png
    122.1 KB · Views: 306
Here's a promising example of a Stage 2 continuation. ESRX made the Stage 2A breakout on 18th Jan, but there wasn't much volume behind it, so it has had a slow grind higher through Q1. However, yesterday it made a continuation move, which looks to have been confirmed today and it is promising as the volume has picked up as well as the Mansfield RS breaking above the zero line into positive territory. It has also outperformed the health care sector and it's sub-sector since the October low. So it's one for consideration but would need a fairly big stop loss at the current price, so it might be better to wait for a retest of the breakout level for a lower risk entry.
 

Attachments

  • ESRX_weekly_RS_3_4_12.png
    ESRX_weekly_RS_3_4_12.png
    121.4 KB · Views: 336
  • ESRX_weekly_3_4_12.png
    ESRX_weekly_3_4_12.png
    119.1 KB · Views: 319
US 30 Year Treasuries Stage Analysis

US 30 year Treasuries had a big move lower yesterday following the Fed minutes engulfing the previous days action. This has pushed price back down near the lower end of the Stage 3 range and near the Stage 4A breakdown level of below 135. Price is below the 200 day MA again so I'm keeping a close eye on this for a breakdown or reversal. The volume and relative performance evidence currently favours it breaking down, but we need to be prepared for either as it will affect the stock market direction.
 

Attachments

  • US_30yr_Treasuries_3_4_12.png
    US_30yr_Treasuries_3_4_12.png
    124.8 KB · Views: 269
Last edited:
Gold (GC) Stage Analysis

Gold is on the move as well and is currently (12.25pm) below it's 3 and half year trend line and making new lows for the last few months. I noted on the weekend that it would need to close a day below 1627.50 to make a Stage 4A breakdown. So today could be that day as it's currently broken below that, but we'll see what happens when the open outcry futures session starts at 13.30pm.
 

Attachments

  • GC_weekly_3_4_12.png
    GC_weekly_3_4_12.png
    119.8 KB · Views: 318
Gold (GC) Stage Analysis

To follow up the earlier post. Gold futures settled the day at 1614.10, which was well below the 1627.5 breakdown level, so I consider it in Stage 4A now. If you are looking to short it around here then I'd set a trader stop loss at 1708.01 on the GC futures contract for protection if it reverses.
 

Attachments

  • GC_weekly_4_4_12.png
    GC_weekly_4_4_12.png
    124.7 KB · Views: 325
AIG was highlighted in the February GTA reports Most Promising S&P Stocks and then again in March where Stan said the following about it:

American Intl. Group (AIG-NY-29.80) continues to display fine relative strength, and pullbacks toward support now in the 27.50-28.50 zone should be used for additional buying. Protect with a 25.39 trading sell stop and a 23.99 investing stop. Global trend Alert Volume 23, Issue 3, March, 2012

Yesterday it made a Stage 2 continuation move, showing excellent relative strength versus the falling market. Volume has also increased the last few weeks so this is now looking more promising. If you were going to buy it, then I think it should be bought on a pullback towards yesterdays breakout level around the 30.37 to 31.5 zone, with a trader stop loss below the recent lows of 27.6 imo.
 

Attachments

  • AIG_weekly_4_4_12.png
    AIG_weekly_4_4_12.png
    107.6 KB · Views: 321
UK Banks in Focus

I thought it would be good to have a look at the major UK banks and determine what Stage they are currently at as they have a large weighting in the FTSE 100.

Barclays (BARC.L) is the strongest as made a Stage 2A breakout back in January, but formed a swing high in March and has now pulled back to retest the breakout level of 217.70 today. So there's the possibility of a secondary lower risk entry around this level if the support holds and it forms a new swing low. However the short term price action is still negative currently.

HSBC (HSBA.L) made a tentative Stage 2A breakout in February that failed, and then again in March and failed again and has been forming a flag formation along the 200 day MA and so is currently back Stage 1. Look for a daily close above 587.20 for a new Stage 2A breakout.

Lloyds (LLOY.L) had a strong move off of it's lows in November and was up 70% or so, but failed to break above the 38.10 resistance from October 2010's high and has pulled back below it's 200 day MA. A possible head and shoulders pattern if it forms a higher low on this down move and then goes on to breakout above 38.10 resistance and into Stage 2A. So it is currently in Stage 1.

RBS (RBS.L) also made a 70% move off its November low and looks very similar to the Lloyds chart with another possible head and shoulders pattern forming and not managing to get to Stage 2A. It's currently in Stage 1 and would need to get a daily close above 29.92 to reach a new Stage 2A phase.

So the group looks to have potential as are mostly in Stage 1, but they are highly correlated with the broad market so we need to be patient and wait for the right entry points.
 

Attachments

  • RBS_weekly_5_4_12.png
    RBS_weekly_5_4_12.png
    114 KB · Views: 235
  • LLOY_weekly_5_4_12.png
    LLOY_weekly_5_4_12.png
    111.1 KB · Views: 322
  • HSBA_weekly_5_4_12.png
    HSBA_weekly_5_4_12.png
    119.6 KB · Views: 322
  • BARC_weekly_5_4_12.png
    BARC_weekly_5_4_12.png
    118.5 KB · Views: 317
Taking the current market stage into consideration, the method recommends looking for more Stage 2 continuation moves than initial Stage 2A breakouts. So with that in mind I've found a new entrant to the S&P 500 that seems to have attracted some big money on the 3rd April as it had a large volume spike on that day. FOSL (Fossil) made a Stage 2 continuation move on Friday to close at new all time highs. The relative performance is excellent as it's outperformed the S&P 500 by 37% since the October lows and is currently in the top 2% of S&P 500 stocks for relative performance.

If you choose to trade it then the trader stop loss position should be around 129.29 imo. Attached is the charts.
 

Attachments

  • FOSL_weekly_5_4_12.png
    FOSL_weekly_5_4_12.png
    110.6 KB · Views: 354
  • FOSL_weekly_RS_5_4_12.png
    FOSL_weekly_RS_5_4_12.png
    110.5 KB · Views: 341
Major charts for analysis

The major stock indexes pulled back this week with most of the major indexes closing in negative territory after initially moving higher. The Nasdaq 100 was the only standout with a slightly higher close on the previous week. The indexes are all in Stage 2B, so we should be looking to buy on pullbacks to support levels and also making Stage 2 continuation buys until the market starts to form a Stage 3 top - which there's no sign of yet, as we still haven't had a significant pullback; although the last months price action is suggestive imo that one could possibly be beginning. So selective stock picking on the long side is required at the moment for new trades as risk is heightened at this stage of the cycle.

Gold (GC) moved down this week to make a Stage 4A breakdown close below the 3 and half year trend line. This was supported by the Dollar Index (DX) bouncing off of it's own trend line support to close the week just above the 80 level and back above it's 50 day MA.

Copper (HG) continues to form a triangle formation along the 200 day MA and needs to break above $4 resistance to move into Stage 2A.

Crude Oil (CL) had an indecisive week, breaking below recent support and then bouncing around the upper range of it's November to February Stage 1 consolidation. It's still in Stage 2, but it needs to recover strongly back above the 50 day MA or it could fall back to test the lower end of the previous Stage 1 range.

Finally that leaves the Treasuries (US & TY), which had a largely positive week. Although Friday's big move higher in both the 10 year and the 30 year Treasuries was on a thin market. We're in Stage 3 now, with the price's retesting the previous breakdown levels on both with Friday's close. So if they manage to continue higher this week then stocks will come under some more pressure.

Below is the charts for your own stage analysis.
 

Attachments

  • FTSE100_weekly_6_4_12.png
    FTSE100_weekly_6_4_12.png
    128.2 KB · Views: 343
  • DAX_weekly_6_4_12.png
    DAX_weekly_6_4_12.png
    120.2 KB · Views: 328
  • IWM_weekly_6_4_12.png
    IWM_weekly_6_4_12.png
    117.9 KB · Views: 317
  • NDX_weekly_6_4_12.png
    NDX_weekly_6_4_12.png
    116.8 KB · Views: 332
  • SPX_weekly_6_4_12.png
    SPX_weekly_6_4_12.png
    119.1 KB · Views: 332
  • GC_weekly_6_4_12.png
    GC_weekly_6_4_12.png
    120.8 KB · Views: 306
  • HG_weekly_6_4_12.png
    HG_weekly_6_4_12.png
    126.5 KB · Views: 332
  • CL_weekly_6_4_12.png
    CL_weekly_6_4_12.png
    129.1 KB · Views: 324
  • US_30yr_Treasuries_6_4_12.png
    US_30yr_Treasuries_6_4_12.png
    119.3 KB · Views: 308
  • TY_10yr_Treasuries_6_4_12.png
    TY_10yr_Treasuries_6_4_12.png
    119.1 KB · Views: 305
  • DX_weekly_6_4_12.png
    DX_weekly_6_4_12.png
    122.2 KB · Views: 322
US Industry Sectors & Sub-sectors

It was a down week for all the major US industry sectors except for Technology (XLK) which finished the week slightly higher. It's the first time this year that so many sectors have been down, so it suggests some caution is needed this week.

Technology (XLK, Consumer Discretionary (XLY) and Financials (XLF) are the top three sectors by the Mansfield RS reading still. Energy (XLE) is still the weakest.

attachment.php


The US Sub-sectors didn't have much movement at the top or bottom this week. But last weeks fifth strongest - Dow Jones US Home Construction Index (^DJUSHB) - dropped out of the top five into eighth and was replaced by Dow Jones US Pipelines Index (^DJUSPL), which has 2 stocks in the S&P 500 which are; El Paso Corp (EP) and Williams Cos Inc (WMB).

The bottom five had little change and Dow Jones US Coal Index (^DJUSCL) is still the weakest sub-sector, with the other weakest being the metals and miners.

Here's the updated top and bottom US Sub-sectors:

Top five strongest sub-sectors:
1. ^DJUSCR - Dow Jones US Computer Hardware Index
2. ^DJUSTT - Dow Jones US Travel & Tourism Index
3. ^DJUSHI - Dow Jones US Home Improvement Retailers Index
4. ^DJUSDS - Dow Jones US Industrial Suppliers Index
5. ^DJUSPL - Dow Jones US Pipelines Index

Bottom five weakest sub-sectors:
1. ^DJUSCL - Dow Jones US Coal Index
2. ^DJUSMG - Dow Jones US Mining Index
3. ^DJUSPM - Dow Jones US Gold Mining Index
4. ^DJUSPT - Dow Jones US Platinum & Precious Metals Index
5. ^DJUSAL - Dow Jones US Aluminum Index
 

Attachments

  • US_Industry_Sectors_list_6_4_12.png
    US_Industry_Sectors_list_6_4_12.png
    20.7 KB · Views: 1,261
  • US_Industry_Sectors-D_6_4_12.png
    US_Industry_Sectors-D_6_4_12.png
    111.7 KB · Views: 320
  • US_Industry_Sectors_6_4_12.png
    US_Industry_Sectors_6_4_12.png
    119.7 KB · Views: 344
It's been a little while since I put the momentum charts up as there hadn't be in any change in trend. However, this week the weekly momentum rolled over for the first time since early December and the 200 week Advance Decline line moving average also broke down from it's recent range. If you compare with the 2010 Stage 2 move this happened first in Jan 2011 and signaled that the move was beginning to get tired, but was a few months before the top was put in.

The 200 day moving average of the NYSE advance decline figures - which Weinstein calls his Momentum Index can be seen on the daily chart. This has moved sideways since early February and is close to the lower part of its range currently, whereas price has continued higher. So momentum is definitely diverging from the price action.

Attached is the charts
 

Attachments

  • SPX_momentum_6_4_12.png
    SPX_momentum_6_4_12.png
    137.1 KB · Views: 327
UK FTSE 350 Sectors

Below is the latest UK FTSE 350 Sectors charts and Mansfield Relative Strength rankings. FTSE 350 Sector Oil Equipment Services & Distribution Index (^NMX0570) moves into the top spot this week from second place last week. Beverages (^NMX3530) is the big mover though, jumping from 9th up to 3rd place in the Mansfield relative strength rankings. Below is the full list in rank order and attached is the updated charts:

attachment.php
 

Attachments

  • UK_Sectors_1_6_4_12.png
    UK_Sectors_1_6_4_12.png
    105.9 KB · Views: 293
  • UK_Sectors_2_6_4_12.png
    UK_Sectors_2_6_4_12.png
    105.4 KB · Views: 279
  • UK_Sectors_3_6_4_12.png
    UK_Sectors_3_6_4_12.png
    107.3 KB · Views: 251
  • UK_Sectors_4_6_4_12.png
    UK_Sectors_4_6_4_12.png
    104.3 KB · Views: 300
  • UK_Sectors_list_6_4_12.png
    UK_Sectors_list_6_4_12.png
    51.6 KB · Views: 1,242
Market Breadth

attachment.php


I did start a new thread for the market breadth charts, but as they are used by Weinstein in his Global Trend Alert for some of the broader analysis of the market, I thought it's probably more useful to include them in this thread instead to help with the market analysis.

There were a few changes this week on the short and medium term market breadth charts of the NYSE Percent of Stocks Above 50 Day Moving Average ($NYA50R) and the NYSE Percent of Stocks Above 150 Day Moving Average ($NYA150R). The $NYA50R moved to bear confirmed status and has moved down to 50%. So only 50% of stocks in the NYSE are now above their 50 day moving average. The $NYA150R also moved to Os but has yet to give a sell signal as it would need to move one box lower - so it is now on bear alert status in a high risk field position with 77.27% of stocks now above their 150 day moving average.

The longer term breadth charts of the NYSE Bullish Percent Index ($BPNYA) and NYSE Percent of Stocks Above 200 Day Moving Average ($NYA200R) are still on Bull confirmed status and in a column of Xs. So the longer term picture is still good although short term the breadth charts are showing weakness as 39% less stocks are above their 50 day moving average than in early February now, so this is a cause for near term concern.

Below are the breadth charts:

NYSE Bullish Percent Index ($BPNYA) - this is a compilation of the percent of stocks that trade on the NYSE that are on Point and Figure buy signals and tells you whether to be offensive or defensive with your strategy.

  • Xs = offense
  • Os = defense
  • 30% and 70% are the oversold and overbought areas where risk is highest
  • All stocks have an equal vote

attachment.php


NYSE Percent of Stocks above their 200 day moving average ($NYA200R) - this is a measure of the percent of stocks on the NYSE that are trading above their 200 day moving average

attachment.php


NYSE Percent of Stocks above their 150 day moving average ($NYA150R)- this is a measure of the percent of stocks on the NYSE that are trading above their 150 day (30 week) moving average

attachment.php


NYSE Percent of Stocks above their 50 day moving average ($NYA50R)- this is a measure of the percent of stocks on the NYSE that are trading above their 50 day (10 week) moving average

attachment.php


For more information on how the breadth charts are created you can visit:Investors Intelligence Global - Breadth Indicators or go to the Dorsey Wright P&F university mini site, which explains in detail and has a quick online test to help you understand: PnF University
 

Attachments

  • NYA50R_5-4-12.png
    NYA50R_5-4-12.png
    17.3 KB · Views: 1,228
  • NYA150R_5-4-12.png
    NYA150R_5-4-12.png
    18.1 KB · Views: 1,161
  • NYA200R_5-4-12.png
    NYA200R_5-4-12.png
    19.3 KB · Views: 1,221
  • $BPNYA_5-4-12.png
    $BPNYA_5-4-12.png
    18.1 KB · Views: 1,240
  • market-breadth-table_6-4-12.png
    market-breadth-table_6-4-12.png
    11.3 KB · Views: 1,115
Attached is my current watchlist picks
 

Attachments

  • Watchlist_W_9_4_12.png
    Watchlist_W_9_4_12.png
    99.7 KB · Views: 352
  • Watchlist_D_9_4_12.png
    Watchlist_D_9_4_12.png
    97.6 KB · Views: 320
My friend found a promising pick today which I really liked. It is Victrex (VCT.L) which is in the Chemicals sector which is currently the top sector based on Mansfield RS.

Victrex is in Stage 1B and the Manfield RS has just gone positive and cumulative volume is on a steady increase.

So I went long VCT.L at 1417.69 and have put my sell stop at 1317.66

Attached is the charts
 

Attachments

  • VCT_weekly_12_4_12.png
    VCT_weekly_12_4_12.png
    126.1 KB · Views: 337
I did a post on the UK banks last week and noted the following about Barclays (BARC.L)
Barclays (BARC.L) is the strongest as made a Stage 2A breakout back in January, but formed a swing high in March and has now pulled back to retest the breakout level of 217.70 today. So there's the possibility of a secondary lower risk entry around this level if the support holds and it forms a new swing low. However the short term price action is still negative currently.

This weeks price action has so far been positive with BARC.L bouncing around the Stage 2 breakout support. If it can close the week around it's current level or higher then it could be a good low risk secondary entry point for it, with a stop loss under the 200 level - so below this weeks swing low and the 200 day MA.
 

Attachments

  • BARC_weekly_12_4_12.png
    BARC_weekly_12_4_12.png
    116.4 KB · Views: 314
A second down week for the S&P 500 has pulled the price back to the secondary breakout level of 1370, which is also just below the 50 day moving average. It's possible that we may be at the secondary entry point as a lot of individual names have pulled back to their Stage 2 breakout levels. But we need to watch the price action carefully this coming week as the recent negative tone could continue and if it does then 1340 is the level to watch imo on the downside.

The other indexes all traded lower last week including the Nasdaq 100, which rolled over for the first time since December lead by Apples down week. The worst was the FTSE 100 which closed below it's breakout point to close near it's 200 day MA. But the Russell 2000 small caps held the range it's been developing since February, after a brief break below it.

The Gold chart continues to look weak in Stage 3, but had an up week following the previous weeks breakdown. The price has been trading under the 200 day MA for the last five weeks though and also has not manged to rebound convincingly off the 3 and half year trend line, which in the past has been the swing point. If price trades below the 200 day MA this week then the 50 day MA and the 200 day MA will have a negative crossover. So the new Stage 4A breakdown point I'm looking for is a close below 1613, but if it can get back above 1700 then it could see a strong rally.

Copper was very weak last week and saw a high volume sell off below it's recent trading range on China GDP concerns as well as being dragged by broad market sell off. However, as you'll see from the China Shanghai Composite chart which I've included, the Chinese clearly didn't think it was as bad as Wall Street did and shrugged it off on Tuesday to trade the rest of the week higher and has now formed a higher low on the weekly chart and looks to be forming a possible Stage 1 range although it could still be considered a Stage 4B-

Crude Oil made a similar move to Copper and couldn't break back above the recent trading range lower resistance. But, it is sitting right at it's Stage 2 breakout level, so it could be a possible secondary entry point if it can pivot higher this coming week.

Treasuries have been very interesting the last few weeks. The 10 year has traded up very close the top of it's Stage 3 range and is in striking distance of breaking out into a Stage 2 continuation. However, the 30 year chart doesn't back it up yet, as that still has a lot of resistance above it in it's Stage 3 range and the 50 day MA and the 200 day MA are moving towards a possible negative crossover, suggesting that the move higher might be a whipsaw to catch people out. The cumulative volume shows that although the price has moved higher, the volume has not come back in. So it's a weak rally and so vulnerable if any negative volume attempts to push it down again.
 

Attachments

  • SPX_weekly_13_4_12.png
    SPX_weekly_13_4_12.png
    118.5 KB · Views: 312
  • IWM_weekly_13_4_12.png
    IWM_weekly_13_4_12.png
    118.4 KB · Views: 223
  • DAX_weekly_13_4_12.png
    DAX_weekly_13_4_12.png
    120.7 KB · Views: 315
  • FTSE100_weekly_13_4_12.png
    FTSE100_weekly_13_4_12.png
    127.1 KB · Views: 261
  • TY_10yr_Treasuries_13_4_12.png
    TY_10yr_Treasuries_13_4_12.png
    121 KB · Views: 228
  • US_30yr_Treasuries_13_4_12.png
    US_30yr_Treasuries_13_4_12.png
    120.7 KB · Views: 291
  • CL_weekly_13_4_12.png
    CL_weekly_13_4_12.png
    129 KB · Views: 238
  • HG_weekly_13_4_12.png
    HG_weekly_13_4_12.png
    124.4 KB · Views: 296
  • GC_weekly_13_4_12.png
    GC_weekly_13_4_12.png
    120 KB · Views: 241
  • DX_weekly_13_4_12.png
    DX_weekly_13_4_12.png
    121.5 KB · Views: 219
  • NDX_weekly_13_4_12.png
    NDX_weekly_13_4_12.png
    115.9 KB · Views: 270
  • SSEC_weekly_13_4_12.png
    SSEC_weekly_13_4_12.png
    120.5 KB · Views: 288
Last edited:
US Industry Sectors & Sub-sectors

There was no positional changes in the major US Industry Sectors this week with Technology still showing the best Mansfield relative strength rating. Below is the table:

attachment.php


The Dow Jones US Tires Index dropped one place to make it into the bottom five weakest sub-sectors, whereas at the top of the list the Dow Jones US Home Improvement Retailers Index moved up two places to claim the top spot this week, and the Dow Jones US Home Construction Index also moved into 5th place as last weeks number five, the Dow Jones US Industrial Suppliers Index, dropped out to 10th place.

Here's the updated top and bottom US Sub-sectors:

Top five strongest sub-sectors:
1. ^DJUSHI - Dow Jones US Home Improvement Retailers Index
2. ^DJUSCR - Dow Jones US Computer Hardware Index
3. ^DJUSTT - Dow Jones US Travel & Tourism Index
4. ^DJUSPL - Dow Jones US Pipelines Index
5. ^DJUSHB - Dow Jones US Home Construction Index

Bottom five weakest sub-sectors:
1. ^DJUSCL - Dow Jones US Coal Index
2. ^DJUSMG - Dow Jones US Mining Index
3. ^DJUSPT - Dow Jones US Platinum & Precious Metals Index
4. ^DJUSPM - Dow Jones US Gold Mining Index
5. ^DJUSTR - Dow Jones US Tires Index
 

Attachments

  • US_Industry_Sectors_list_13_4_12.png
    US_Industry_Sectors_list_13_4_12.png
    19.5 KB · Views: 1,942
  • US_Industry_Sectors_13_4_12.png
    US_Industry_Sectors_13_4_12.png
    120.2 KB · Views: 261
  • US_Industry_Sectors_D_13_4_12.png
    US_Industry_Sectors_D_13_4_12.png
    111.3 KB · Views: 312
Top