Stan Weinstein's Stage Analysis

Re: Sectors

Yes, dawson, you put it very well, that the sector is a lagging indicator.
Thanks isa for your very full answer to me; so you are using sector as confirmatory one month later.

Alan Saunders I think switched from investor approach to trader approach at the market turned in 2007-8, I think, as the investor approach would not be very profitable over the several months as the market trend changes from up to down. I notice you are finding winning buys in a difficult market, so congratulations.
 
Last edited:
Re: Sectors

You can't be too ridged with theses things - the point is that 1 or 2 leading stocks will break out first, followed by 3, 4, 5, 6+ more, the pack comes along. By this time the first 1 or 2 will have done 100% or more & may be resting & basing again for the next leg up. Eventually 1 or 2 stragglers will come up the rear & by this time the sector move is all but over.

So the point is - look for strength in the sector - if you see some strong breakouts (& the market itself is agreeable) then you can take them as an aggressive trade. Otherwise you can wait for confirmation.

Remember the sectors are made up of the stocks that are in it - not the other way around.

Thanks @dawson865, you put it very well. Have you been trading the method for very long?
 
Re: Sectors

Yes, dawson, you put it very well, that the sector is a lagging indicator.
Thanks isa for your very full answer to me; so you are using sector as confirmatory one month later.

Alan Saunders I think switched from investor approach to trader approach at the market turned in 2007-8, I think, as the investor approach would not be very profitable over the several months as the market trend changes from up to down. I notice you are finding winning buys in a difficult market, so congratulations.

Thanks lplate, it's been a very good start for me as the portfolio has outperformed the S&P 500 nicely. I haven't realised all of the gains though as my position sizing hasn't been consistent, so am only up +7.02%, but I intend to start the new year with a consistent position sizing model which I've developed based on the 200 day ATR of a stock. If I'd been consistent with that the gains are currently 19.33% so that is my intention for the new year.

I closed my short in Sports Direct yesterday for a tiny gain as it was taking too long to get started, so I thought my money could be redeployed elsewhere. GBP/EUR is my best performer still using my ATR position sizing method, but Silver's the best performer on an absolute basis.

Here's the current trades list:

Long
10/27/11 SE (Spectra Energy)
11/1/11 RR.L (Rolls Royce)
11/25/11 RAI (Reynolds American)
11/27/11 GBPEUR (Pound/Euro)
12/9/11 YUM (YUM Brands)
12/15/11 BF.B (Brown Forman Corp)
12/16/11 DUK (Duke Energy)

Short
11/24/11 SI_F (Silver)
 
Last edited:
Re: Sectors

Thanks @dawson865, you put it very well. Have you been trading the method for very long?

I discovered weinstein 2 years ago. Its what turned it all around for me.

I don't trade his method as per his book strictly, but I use stage analysis as a way of filtering & following leaders through a cycle.

The most important thing about weinstein is the concepts & theories. I believe if you truly understand these then the actual method you use to find / execute an trade doesn't so much matter. But you will have a clearer understanding of how the market works. And you will know how & where to make big money.
 
Re: Sectors

. . .as the investor approach would not be very profitable over the several months as the market trend changes from up to down. I notice you are finding winning buys in a difficult market, so congratulations.
Isa, may I recap what is going on then, as I am getting confused by the daily and intraday.
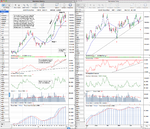
On 10 Dec 11 page 18 you have a weekly SPX chart showing a falling 30 week MA, which turned some months ago.
Normally this would have been associated with a difficult time for trend traders.
You are then saying No you can combat this by choosing the best sectors, e.g. Tobac, Utils, Cons Staples, Healthcare. (What jumps out about these sectors are that they are dividend stocks, by the way, so this reflects a macro problem with growth stocks, which are the motor to a rising stockmarket.)
Another interpretation is that these sectors and stocks are just the star players in a meandering stockmarket, and you may not find they motor much.
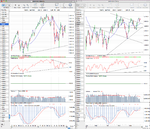
To me, the stockmarket looks like mid 2008 pre Lehmans.
SPY Fund Charts - (NAR) SPDR S&P 500 ETF Trust Fund Charts
You have the long stage two rally, the topping process like started in late 2007, the turn down in the 30 week MA and the lower high. In early/mid 2008 there was a rally into the Lehmans news. There was lots of housing and banking worrying news at the time.
We have a good idea what the Lehmans equivalent news will be not so far away in 2012. In this scenario, aren't we, on a weekly "investor" basis, better sitting it out?
Alan Saunders at the time identified all these turns very early and very accurately, but, as you would expect, this did mean very few strong opportunities and difficult performance, as I remember it. ShareHunter Unfortunately his blog goes back only to 2009, but I have looked back in my diary and he assessed around May 2008 as a bear market rally and one for sitting on hands. That is a feature of Weinstein, that you can have multi-month periods of difficulty and sitting on hands. Stop losses, by their nature in weekly trend following, have to be a good distance away, so you can't afford to get the big picture wrong.
For me, though, the big worry is the prospect of massive state intervention to prevent the consequences of EUR collapse, and this could send the stockmarket (and silver!) rocketing, against all the technical signs.
 
As I've said before, my aim is to forward test the method as accurately as is possible from the little information we have. i.e the book, global trend alert newsletter sample, various interviews and articles by other people that say they use the method. Weinstein has been asked to update the book from what I've read, but has stated that it doesn't need to be as everything you need is in it already. Although we know from the Global Trend Alert Newsletter that he's made an addition of the A and B sub stages, but otherwise we are told that everything is the same.

From my interpretation I agree that currently from the investor point you should be sitting out, as we are only in Stage 1A on the S&P 500, so that is not a time to be sitting in long term positions as you shouldn't start accumulating Stage 2 breakouts until the market has stabilised in Stage 1. However, if you are following the more active trader method then I think you should be hedging any plays you make by buying stocks in the strongest sectors and shorting stocks in the weakest sectors. I've taken it a bit further by including the forex market and commodities to further diversify and reduce correlation. But of my 13 trades during this quarter, 6 have effectively been shorts, and 7 have been long. However, some of the shorts have underperformed and 2 have been stopped out, and one was closed near break even. So from my hedged stance I have currently 11 winners and 2 losers.

With regards to the sector rotation. This is a feature of other excellent methods that I mentioned before from companies like Dorsey Wright, that have done studies that show it to be an effective model. I believe this partly due to the fact that there are long only funds that have to be invested in the market. So when there's panic everything drops initially in tandem, however, sector rotation then begins quickly and money moves into defensive sectors while the rest of market continues on down. If the market becomes a bear market then all sectors will likely fall. But the strongest sectors will be the last to roll over and will likely outperform the market as a whole.

I've been thinking about how the market works recently and the fact that it is trying to price the future. So for example for the last six months the Market has been pricing in Armageddon in Europe, with Greece leaving and the Euro collapsing. Whereas the technical's have slowly been improving, with the market moving into early Stage 1, and the short and long term breadth indicators have been giving early buy signals very recently. So following the method I believe I need to ignore the news headlines as it is a technical method and is suggesting that the path of least resistance is currently neutral to slightly positive imo.
 
Thanks

I just wanted to say a big thank you to everyone that's joined in the discussion this year. It's really helped me to talk about it with others while trying to learn the method. And it's really helped me to focus and has kept me from going off track. So thanks everyone and I hope you've found it useful as well. :cheers:

As well as carrying on with this thread in the new year I intend to add a forum section to my Stage Analysis blog Stage Analysis that I recently set up, so that I can have threads for individual stocks, sectors, commodities etc, so that it's easier to find and discuss specific stocks or commodities stages. I doubt it will have many users as it's so specific and not many people trade this way, but hopefully it will help us all to learn and be a useful resource. I've not added it yet to the site as I need to plan it and get the vBulletin software, but it should be live in the next month or so.
 
Last edited:
re your last sentance in post 186. before i had read your post i was thinking the same while out walking this morning. i was thinking that everyone is sooooo bearish it is having a negative influence on me. i must block out outside influences of news etc and just follow the charts. the charts to me at the mo are neutral so i must just be light in both longs and shorts. next year the market could go up down or sideways. at this particular moment no one knows, in fact no one will until it has started either way..its been drummed into me that europe bust, usa bust etc etc that mkt must go down, but that not necessarily the case. time will tell..
happy new year to all
 
blackmamba and isatrader, you don't really know what the market is pricing in; it prices in only what it feels at the time, and who knows what that is.
The technical case for saying it is too bearish or is pricing Armageddon is that the TLT is at the same level as Christmas 2008, i.e. AFTER Lehmans, not before. SPY vs TLT (20yr Treas)
Technically all you had in late 2007 to early 2008 was a peak in late Sept 2007, a lower high, a turn down in the 30 week MA, a move below the 30 week MA, and another lower high.
Likewise in 2011 you have a peak in late April, and so on. We are now faltering at that second lower high. (Treas and USD also look like they may go higher.)
Anyway, thanks for explaining isa about your use of "trading" daily and currencies and commodities. Yes, there is nothing to prevent you trading in other ways until the stage 3 (or continuation 1) has finished.
(Commods should measure against the CRB index, I suppose, and currencies against the DXY or Gold.)
It does go to show the differences in interpretation, though, don't you think, and as Dawson says there is no strict blueprint for how you use the Weinstein book?
 
Last edited:
blackmamba and isatrader, you don't really know what the market is pricing in; it prices in only what it feels at the time, and who knows what that is.
The technical case for saying it is too bearish or is pricing Armageddon is that the TLT is at the same level as Christmas 2008, i.e. AFTER Lehmans, not before. SPY vs TLT (20yr Treas)
Technically all you had in late 2007 to early 2008 was a peak in late Sept 2007, a lower high, a turn down in the 30 week MA, a move below the 30 week MA, and another lower high.
Likewise in 2011 you have a peak in late April, and so on. We are now faltering at that second lower high. (Treas and USD also look like they may go higher.)
Anyway, thanks for explaining isa about your use of "trading" daily and currencies and commodities. Yes, there is nothing to prevent you trading in other ways until the stage 3 (or continuation 1) has finished.
(Commods should measure against the CRB index, I suppose, and currencies against the DXY or Gold.)
It does go to show the differences in interpretation, though, don't you think, and as Dawson says there is no strict blueprint for how you use the Weinstein book?

There is no strict blueprint for anything to do with trading. Weinstein's, no doubt, excellent book is full of good ideas on the subject, I'm sure. The detail must be in one's own head and, as you say, the differences in interpretation are wide. I have not read the book but it has been drawn to my attention, not by the article, but by Isatrader's excellent thread which I am following with great interest. Who know's? Perhaps one day I will have something useful to add to it.

Prosperous trading in 2012 to you all.
 
blackmamba and isatrader, you don't really know what the market is pricing in; it prices in only what it feels at the time, and who knows what that is.
The technical case for saying it is too bearish or is pricing Armageddon is that the TLT is at the same level as Christmas 2008, i.e. AFTER Lehmans, not before. SPY vs TLT (20yr Treas)
Technically all you had in late 2007 to early 2008 was a peak in late Sept 2007, a lower high, a turn down in the 30 week MA, a move below the 30 week MA, and another lower high.
Likewise in 2011 you have a peak in late April, and so on. We are now faltering at that second lower high. (Treas and USD also look like they may go higher.)

I agree we don't know what's priced in, and I'm sure if Europe did collapse that it would drop the market further very quickly. But at the same time I think because it's been trying to price it in for 6 months that the actual event could be the final flush out of the weak hands and would clear the decks for a possible new bull run. Or it could be the beginning of new longer term bear market move. I think however what Weinstein's method has taught me is that it doesn't matter what I think personally, I just need to follow the price action that occurs and make plays based on it. So currently we are in Stage 1A on the S&P 500 and above a flat 30 week weighted moving average, which is neutral territory still.
Anyway, thanks for explaining isa about your use of "trading" daily and currencies and commodities. Yes, there is nothing to prevent you trading in other ways until the stage 3 (or continuation 1) has finished.
(Commods should measure against the CRB index, I suppose, and currencies against the DXY or Gold.)
It does go to show the differences in interpretation, though, don't you think, and as Dawson says there is no strict blueprint for how you use the Weinstein book?
Agreed, there are many ways to use it and people will interpret it differently, they always do with any method. But there are also lots of things in there that aren't open for interpretation really, like the long term entry points and how to manage your stop loss etc. My personal plan is develop a deeper understanding of stages as I think correct identification of them is the key as getting into a move at the right point, which is critical to long term success imo.

Happy New Year
 
US 30 Year Treasuries

US 30 Year Treasuries have continued to consolidate near the highs. The weekly chart is currently in Stage 2B still. It made a weekly closing high three weeks ago, but failed to make a new high overall but is still near the highs, so it could breakout higher. However, momentum on the 30 week MA is slowing and a Stage 3 top looks to be developing, but it is still rising at the moment and price has yet to break it. So I consider it Stage 2B until the stop below 139.5 is breached.

Price broke below the short term trend line and is trying to break back above it again and relative performance versus the S&P 500 is flattening out.

So watch for a Stage 2 continuation move above the high or Stage 3A breakdown below the 30 week weighted moving average and stop position below 139.5
 

Attachments

  • US-30-Year-Treasuries_30_12_11.png
    US-30-Year-Treasuries_30_12_11.png
    133.4 KB · Views: 252
So currently we are in Stage 1A on the S&P 500 and above a flat 30 week weighted moving average, which is neutral territory still.

Just thought I'd put in my 2 cents - you keep mentioning that the s&p is in stage 1. I believe that it is actually in stage 3. Not because i believe that stage 4 is coming - I have no idea what this year holds - but if you look at leading stocks from this cycle most of them are topping in stage 3 or early stage 4.

If the market goes higher from here then its just a "continuation" move. If lower then we move into a confirmed stage 4. If you look at the weekly we are in the same situation as early to mid 2008 and only a more severe version than mid 2010.

Anyway you are right that it is a neutral market - however I think right atm the long (stage 1 to stage 2) side of things is not the path of least resistance.

Of course this is all fluid & can change over the coming weeks.
 
isa
I think Dawson is right on either stage 3 or early stage 4
The 30MA is moving down, not sideways (top of p 14 instructs on this). (The 10 week MA is moving upwards it is true, and the 6 month chart could be seen as potentially bullish. It is a triangle, so is a potential continuation as Dawson says, isn't it?)
The forest to trees idea (p75) suggests to me it is not a good idea to buy shares at the moment, even for Trader method. Weinstein (p 61) suggests using Trader method only within a Stage 2 (or selling in a Stage 4), i.e. it should be in the direction of the bigger picture.
This shows, no matter how simple Weinstein's method appears, how the key principles can be interpreted differently in practice.
 
As we seem to be disagreeing on the current Stage of the S&P 500 I've laid out the sub-stage definitions from the Global Trend Alert Newsletter below and will explain why I personally think it's now Stage 1A.

Stage 1A - Start of a base. Needs much more time.
Stage 1 - Basing Phase. May begin accumulation.
Stage 1B - Late in base-building phase.Watch for breakout.

Stage 2A - Early in uptrend stage. Ideal time to buy aggressively.
Stage 2 - Advancing Stage
Stage 2B - Getting late in uptrend. Watch carefully. But still a hold.

Stage 3A - Looks as if a top is starting to form. Be sure to protect holdings with a close stop.
Stage 3 - The Top Area. Start to reduce positions.
Stage 3B - Has become increasingly toppy. Use rallies for at least partial selling.

Stage 4A - Stock has entered Downtrend Stage. Close out remaining positions.
Stage 4 - The Declining Stage. Avoid on the long side.
Stage 4B - Late in downtrend. Much too soon to consider buying.

Additional ratings
(A) Early in that Stage.
(B) Late in that Stage.
(+) Outstanding pattern in that Stage.
(–) Unexciting pattern in that Stage.

Below is the most recent interview with Stan Weinstein from 12th November 2011. The interview starts around 30 minutes into the recording.

Technician Stan Weinstein: Markets Still in Neutral Territory, Still Opportunities to Make Money Jim

During the interview on 12th November Weinstein says the S&P 500 is in Stage 4B- (Which from the definitions above is - Late in downtrend. Much too soon to consider buying. So it is eight weeks later now and the S&P 500 has since made two higher lows. The 30 week weighted* moving average is flat as has been moving between up an down randomly for the last 8 weeks, with a total of 4 down weeks and 4 up weeks. Currently it has turned up for the last two weeks (see my chart attached). Price has broken out of and held above a 10 month down channel for the first time, although this was during the light volume year end week. Price has also managed to close above the flat 30 WMA for 5 weeks in a row now, so by my interpretation of the method and extrapolating from Stan Weinstein's own rating in early November I think we have now moved into Stage 1A, although it could deserve a minus rating as it is an unexciting pattern in that Stage. So I agree that this isn't a time to be buying or selling until the market moves into either a Stage 4 continuation move (below 1158 for me) or stabilises further into a proper Stage 1 - where he says you may begin accumulation.

*The 30 week weighted moving average - from my study of the book I came to realise that even though he talks about the 30 week moving average. He was actually using the 30 week weighted moving average, as that is what the Mansfield charts he uses for all of his actual examples uses. So this is one of those grey areas from the book that is open to interpretation. Currently if you use the 30 week simple moving average it is still in a downtrend although momentum has slowed. However if you use the weighted 30 week MA - as the Mansfield charts did - the MA has been flattening for the last 10 weeks and has turned slightly up for the last 2 weeks. So to be clear, I'm going to stick to using the weighted moving average as I think this the most faithful to real examples from the book.

As always this is just my opinion from my interpretation of it.
 

Attachments

  • SPX_weekly_30_12_11.png
    SPX_weekly_30_12_11.png
    130.6 KB · Views: 323
Last edited:
2007-2008 Comparision

Attached is a chart showing the 2007-2008 similar period alongside today's chart with Weinstein's advance decline momentum indicator and my 30 week MA momentum indicator. I hope it will further explain my current position on the Stage I think we're at, as although the charts look similar, I can see a number of important differences from the price action and the secondary momentum indicators. The advance decline breadth data especially.
 

Attachments

  • SPX_comparison-2008-now.png
    SPX_comparison-2008-now.png
    119.4 KB · Views: 784
Last edited:
Re: 2007-2008 Comparision

isa
This is a great thread, and thank you for your detailed responses to our questions. I see exactly how you see things now, and your analysis is much more detailed than mine (which is based simply on the price and the 30week SMA, though, as I can get it on the free charts, I have added the potential MACD identical cross/zerofailure repeating mid 2008 also).
Just on one point, though, Weinstein's diagrams on the A/D line as confirmation (pp 76-77). He clearly says to increase your odds the A/D direction ideally should confirm the direction of the market, but in your chart it does not confirm the higher low. Instead it goes flat.
Keep up the great work.

Thanks lplate, I appreciate it and I hope you will continue to contribute to the thread as even though you disagree in certain areas it's good to be challenged on things and makes me try to be more thorough with my work.

I agree with your analysis of the A/D line. It hasn't confirmed the higher low, but at least it's not falling off a cliff this time. Although that could change if the Euro really does fall apart. So will keep my eye on it.
 
I think this point on TLT is spot on...we are pretty much at the Dec 2008 highs here on TLT at the height of the doom and gloom back then. I’m thinking TLT can’t just go up another 20% from here (although EU breakups could trigger it but I don’t think that’s likely).

I’m not ready to short TLT or buy TBT just yet…unlike the Dec 2008 boom in TLT, we are seeing way more buying volume this time around and the chart actually looks way stronger now than it did back then. We would have to see a big drop in price for the 30-week MA to begin flattening out and get into stage 3. The daily chart on TLT looks pretty strong too.

Folks piling into TLT now are likely to be sorry when it reverts back to its mean around $100 or so…

Question for the group: Is there a forum for discussing trading ideas on specific stocks? It’s always helpful to see how others are thinking about applying TA in practice.


[The technical case for saying it is too bearish or is pricing Armageddon is that the TLT is at the same level as Christmas 2008, i.e. AFTER Lehmans, not before.]
 
Question for the group: Is there a forum for discussing trading ideas on specific stocks? It’s always helpful to see how others are thinking about applying TA in practice.

With regards to Weinstein's method, there's no forums for talking about specific stocks. Something that I've started using recently though is StockTwits® - Share Ideas & Learn from Passionate Investors & Traders which has feed for each US stock, so you can see what people are saying and look at a range of analysis from various sites. So you might find that useful.
 
Top