theblackmamba
Active member
- Messages
- 106
- Likes
- 3
thanks for charts..
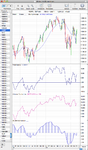
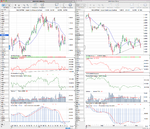
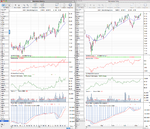
Yes, it has stopped its higher lows and this now looks as if the next bit of bad news will knock it down....EUR/AUD forex pair.
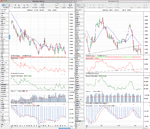
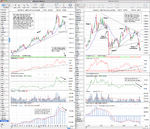
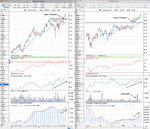
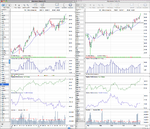
On the monthly it's been in Stage 4 for the last few years. The weekly is in Stage 1 and near the low of the range, and on the daily it has broken it's trendline today after a big down move this week. As the move has been so big I'm going to watch to see what the reaction back up is first before taking a position as the 30 day MA is a long way behind at 1.3472 currently. But it looks like it might give a weekly stage 4 continuation signal by breaking below 1.29 soon.
Yes, it has stopped its higher lows and this now looks as if the next bit of bad news will knock it down.
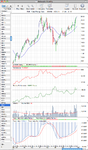
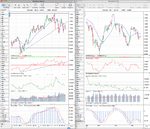
EURAUD 2 yr Weekly
Would you not look at this, not as a monthly, but simply as a weekly, so, until the break occurs, you can't be sure if it is a proper Stage 1 or a continuation break of a bear flag within Stage 4.