Stan Weinstein's Stage Analysis

US Industry Sectors

Attached is the latest US industry sector charts and relative performance table.

Industrials, Consumer Discretionary, Healthcare and Technology are picking up in Stage 1.
 

Attachments

  • Industry_Sector_RS_1_1_12.png
    Industry_Sector_RS_1_1_12.png
    25.2 KB · Views: 292
  • Industry_Sectors_11_1_12.png
    Industry_Sectors_11_1_12.png
    141.2 KB · Views: 315
S&P 500 Railroad Stocks

As the Industrials group is topping my list at the moment I thought I'd have a look through the groups sub-sectors and see what chart was near a Stage 2 breakout.

Railroads (^DJUSRR) stood out as the sub-sector is just below the Stage 2 breakout point and has outperformed the S&P 500 by almost 10% since the October low.

One of the main things to look for with Weinstein buys is whether the stocks in the group are acting in a similar way as this gives extra validation to a Stage 2 breakout. Read pages 78 to 91 in the book as Weinstein explains in detail about this.

In the S&P 500 there are three railroad stocks: CSX Corp (CSX), Norfolk Southern (NSC) and Union Pacific (UNP). UNP has the strongest chart and confirmed a Stage 2 this week; NSC is not far behind and is just below the Stage 2 breakout point, so is currently Stage 1B, and CSX is the laggard in Stage 1. All three are outperforming the S&P 500 and with the Industrials sector now in the later part of Stage 1 the group is looking promising.

Here's the charts
 

Attachments

  • DJUSRR_weekly_12_1_12.png
    DJUSRR_weekly_12_1_12.png
    59.7 KB · Views: 245
  • XLI_weekly_12_1_12.png
    XLI_weekly_12_1_12.png
    61.1 KB · Views: 228
  • UNP_weekly_12_1_12.png
    UNP_weekly_12_1_12.png
    105.6 KB · Views: 224
  • NSC_weekly_12_1_12.png
    NSC_weekly_12_1_12.png
    102.3 KB · Views: 243
  • CSX_weekly_12_1_12.png
    CSX_weekly_12_1_12.png
    95.4 KB · Views: 336
  • SharpChartv05-11.png
    SharpChartv05-11.png
    26.1 KB · Views: 306
  • SharpChartv05-10.png
    SharpChartv05-10.png
    27.2 KB · Views: 257
  • SharpChartv05-9.png
    SharpChartv05-9.png
    27.6 KB · Views: 333
Attached is the updated major charts I follow for analysis. Copper (HG) made it's first weekly close above the 30 WMA and now needs to follow through and close above 3.75 to move into Stage 1A. Gold (GC) and Silver (SI) both ran up into their breakdown levels last week and started to falter at the end of the week. I have Gold as still Stage 3, but very close to a Stage 4 breakdown and Silver has been Stage 4 for a while now. Crude (CL) is a little trickier to call, but looks to be carving out a Stage 1 range between 104 and 92.5

Dollar Index continues to grind higher through it's resistance with a 52 week closing high this week. There's significant resistance for it to get through up to 85. But I'd class it as Stage 1B currently.

US 30 Year Treasuries pushed back above their trendline last week to close near the top of the Stage 2 consolidation range. A continuation move is possible but it's currently still in it's range, so needs watching closely as a continuation move would be very bad for equities as they trade inversely a large majority of the time.

S&P 500 closed near the 1300 breakout point and I'd class it as a Stage 1 now.

Below are my charts
 

Attachments

  • HG_weekly_13_1_12.png
    HG_weekly_13_1_12.png
    128.9 KB · Views: 329
  • GC_weekly_13_1_12.png
    GC_weekly_13_1_12.png
    123.4 KB · Views: 396
  • SI_weekly_13_1_12.png
    SI_weekly_13_1_12.png
    116.8 KB · Views: 306
  • CL_weekly_13_1_12.png
    CL_weekly_13_1_12.png
    129.5 KB · Views: 323
  • SPX_weekly_13_1_12.png
    SPX_weekly_13_1_12.png
    129.9 KB · Views: 295
  • US30_tresuries_weekly_13_1_12.png
    US30_tresuries_weekly_13_1_12.png
    128.5 KB · Views: 280
  • DX_weekly_13_1_12.png
    DX_weekly_13_1_12.png
    121.2 KB · Views: 270
Re: S&P 500 Railroad Stocks

Great work isa.
In tech sector, Netflix an example where of great interest to the "trader" method, but not to the "investor" for many more weeks. Netflix Inc., NFLX Advanced Chart - (NASDAQ) NFLX, Netflix Inc. Stock Price - BigCharts.com

That's not a Weinstein method trade with the traders method either as the NFLX is in Stage 4 downtrend and below it's 30 week MA. And you don't buy stocks below the 30 week moving average with the traders method or the investor method ever. What you've got there is a daily swing trade which is very different to Weinstein's method.
 

Attachments

  • NFLX_weekly_13_1_12.png
    NFLX_weekly_13_1_12.png
    114.5 KB · Views: 293
been a while since i posted anything.
my trading has been flat on the year so far. had one big winner gkp, but this has been offset by liz, ctb, and fosl which has gone against me.
thought i would share my gkp chart and trade as feel it is weinstein example at it's best.
enclosed is a weekly, daily and oil sector shares/(in uk) chart.
the weekly chart shows that between nov 2010, and december 2011 it was in a wide rangeing congestion area of 120 points between 80-200. then at end of december it broke out on a very high trading week, but closed the week back at breakout lecel. then had a week of consolidation on much lighter volume, before resuming breakout. i bought at 205 as started going up again. obviously diodn't expect it to rocket like it did.
as page 193 at the bottom suggests after an unexpected windfall takes place to take partial profits. i did this twice above the 270 level with small positions leaving just under half of original position left.
my stop has now been raised to breakeven, and willl traet it now like the investment section of weinstein does.
 

Attachments

  • oil.png
    oil.png
    30.3 KB · Views: 365
  • gkp1.png
    gkp1.png
    36.4 KB · Views: 335
  • gkp.png
    gkp.png
    32.3 KB · Views: 270
been a while since i posted anything.
my trading has been flat on the year so far. had one big winner gkp, but this has been offset by liz, ctb, and fosl which has gone against me.
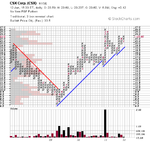
thought i would share my gkp chart and trade as feel it is Weinstein example at it's best.
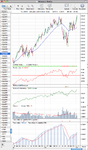
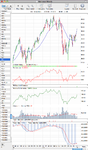
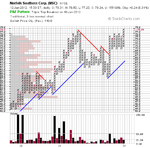
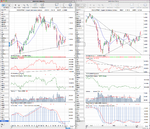
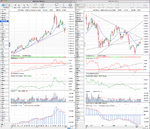
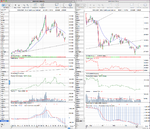
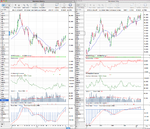
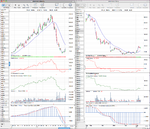
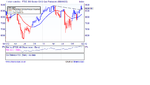
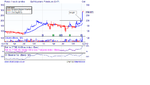
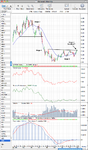
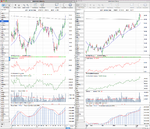
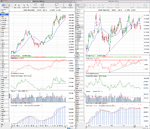
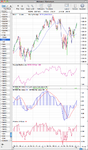
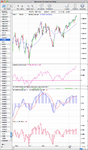
enclosed is a weekly, daily and oil sector shares/(in UK) chart.
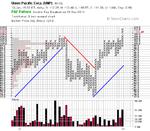
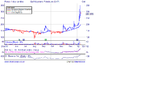
the weekly chart shows that between Nov 2010, and December 2011 it was in a wide ranging congestion area of 120 points between 80-200. then at end of December it broke out on a very high trading week, but closed the week back at breakout level. then had a week of consolidation on much lighter volume, before resuming breakout. i bought at 205 as started going up again. obviously didn't expect it to rocket like it did.
as page 193 at the bottom suggests after an unexpected windfall takes place to take partial profits. i did this twice above the 270 level with small positions leaving just under half of original position left.
my stop has now been raised to breakeven, and will treat it now like the investment section of Weinstein does.

Thanks Peter, that's a really good example of getting in at the right entry point as now you have a nice profit and can follow the rest of the move with either the investor or trader stop and move up your stop initially once you get a new confirmed continuation pivot point and it moves up towards the high again.

Reference material on managing the stop loss can be found in the book in Chapter 6: When to Sell, and specific illustrations for the investor and trader method can be found on pages 184 for the investor and 194 for the trader.

It'll be nice if I can find one of those for myself although I expect I'm less likely to as I'm sticking to the large cap stocks only in S&P 500 and FTSE 350.

Keep up the good work.
 
I've been reviewing the top sub-sectors and currently the Dow Jones US Home Construction Index (^DJUSHB) is outperforming the S&P 500 by the most since the October low and has done 36% better. And going through the stocks I remembered that LEN was brought to my attention by theblackmamba last week.

LEN's monthly chart over the last 15 years is a great example of the four stages and with last weeks close it has now moved back into early Stage 2A. However, although this is the ideal long term investor entry point, it has already moved 81% since the October low so it will most likely need time to consolidate, as it is 27% above it's 30 week WMA, which is the top end of it's normal range. So a safer entry point might be to wait for a reaction back to the breakout point around $21.00

Below is my monthly, weekly and daily charts
 

Attachments

  • LEN_monthly_13_1_12.png
    LEN_monthly_13_1_12.png
    57.4 KB · Views: 271
  • LEN_daily_13_1_12.png
    LEN_daily_13_1_12.png
    117.5 KB · Views: 342
My buy stop order in ADP from 6th January that I posted here: http://www.trade2win.com/boards/technical-analysis/134944-stan-weinsteins-stage-analysis-27.html#post1760120 was filled at $55.13 and I closed out my position in BF.B at $79.88 for a small profit on the 15/12/2011 entry at $78.70, as I decided over the weekend to trim one of the laggards in the portfolio to make room for a new trade possibly in one of the railroad stocks I looked at the other day.

Also, I've exited my Silver short at $30.383 for a good gain on my $32.009 entry on 24/11/2011. It was a lot lower a few weeks back but it didn't reach my $25 target, so I was watching the price action around the $30 resistance level and today's break above it and the Stage 2 breakout in the broad market made up my mind to take my profit and move on to something else.
 
Last edited:
Today's move (18th) and close above 1300 on the S&P 500 moves us into a new Stage. I'm undecided personally whether it's Stage 1B or a fledgling Stage 2A. But it's still got some work to do to get through the resistance above it and break out to new highs on a decent Stage 2 run. So I expect to see some back and forth for a while in this new higher range if it can close the week above 1300.

I personally went long the Nasdaq 100 due to the better relative strength it's shown and lesser amount of resistance it has to overcome to break out to new highs and hopefully a decent Stage 2 run.

The other Stage 2 continuation of note today was Apple (AAPL) which broke out to new all time highs. A measured move from this last consolidation gives me a swing target of 499.
 
UK Sectors

I haven't had a look at the UK sectors for a while. But with last weeks breakouts in the broad markets I thought it might be a good time to re-look at them and see which have the best technical setup to outperform the market in the coming months.

Attached is the charts
 

Attachments

  • UK_Sectors_3_20_1_12.png
    UK_Sectors_3_20_1_12.png
    106.7 KB · Views: 237
  • UK_Sectors_2_20_1_12.png
    UK_Sectors_2_20_1_12.png
    105.9 KB · Views: 241
  • UK_Sectors_1_20_1_12.png
    UK_Sectors_1_20_1_12.png
    105 KB · Views: 221
  • UK_Sectors_list_20_1_12.png
    UK_Sectors_list_20_1_12.png
    92.6 KB · Views: 299
  • UK_Sectors_4-2_20_1_12.png
    UK_Sectors_4-2_20_1_12.png
    102.8 KB · Views: 247
Last edited:
Major charts for analysis

Attached is the major charts for analysis.
 

Attachments

  • US30_treasuries_20_1_12.png
    US30_treasuries_20_1_12.png
    131 KB · Views: 209
  • CL_weekly_20_1_12.png
    CL_weekly_20_1_12.png
    128.9 KB · Views: 270
  • HG_weekly_20_1_12.png
    HG_weekly_20_1_12.png
    128.6 KB · Views: 607
  • GC_weekly_20_1_12.png
    GC_weekly_20_1_12.png
    122 KB · Views: 312
  • SPX_weekly_20_1_12.png
    SPX_weekly_20_1_12.png
    129.7 KB · Views: 765
  • TY10_treasuries_20_1_12.png
    TY10_treasuries_20_1_12.png
    134.2 KB · Views: 326
  • DX_Dollar_weekly_20_1_12.png
    DX_Dollar_weekly_20_1_12.png
    121.1 KB · Views: 277
US Industry Sectors

Attached is my US Industry Sector Stan Weinstein charts. There's been a noticeable shift in the sectors over the last month or so to a more bullish posture with all the charts now out of Stage 4 and at least in Stage 1, and a few more are now close to full Stage 2 breakouts. Technology, Consumer Discretionary and Health Care are all in Stage 1B, and Consumer Staples looks to be making an attempt at a Stage 2 continuation move after pulling back to retest it's breakout level.
 

Attachments

  • Industry_Sectors_20_1_12.png
    Industry_Sectors_20_1_12.png
    124.8 KB · Views: 313
Attached is my updated secondary indicator chart of the S&P 500 which shows the Momentum Index (p284 in the book), which is the 200 day moving average of the NYSE Advance Decline line. It shows that last weeks breakout above 1300 was supported broadly by stocks across the entire New York Stock Exchange.

The other two indicators are my personal indicators of which the middle one measures the speed of the 30 week weighted moving average and the bottom indicator measures the distance price is above the 30 week weighted moving average.
 

Attachments

  • SPX_momentum_20_1_12.png
    SPX_momentum_20_1_12.png
    65.4 KB · Views: 295
  • SPX_momentum_daily_20_1_12.png
    SPX_momentum_daily_20_1_12.png
    61.3 KB · Views: 552
Last edited:
hi isatrader,

I'm a fans of Stan Weinstein and I just found your thread today.
Keep it up and I'll read from page #1 before I can contribute any.
 
Hi isatrader,

yes sure I will join.
I had been trading shortterm as scalper for past 3 years. There is little meat and full of stress.
After going through such a tough period and seeing my brother gaining more than 1000% of his investment just by sitting, I finally see why I should follow Stan's way of doing.

I'm using amibroker and looking for cost effective EOD provider. Anyone to recommend?
 
For brokers it's a bit of a coin toss as all have advantages and disadvantages depending on what you want to trade. I personally use CMC Markets CFDs for my short term trading and trade my long term stocks in an ISA, which is a tax efficient nominee account for UK residents where you buy the actual stocks in the market. Others on here use all sorts of brokers, such as IG Markets, Interactive Brokers etc. It all really depends on what markets you want to trade and what is available to you in Singapore. But if you want to hold stocks for a long time having the actual shares is always better imo as the margin based brokers will eat into any gains through their various fees as they are not meant for long term holdings.
 
Top