As we seem to be disagreeing on the current Stage of the S&P 500 I've laid out the sub-stage definitions from the Global Trend Alert Newsletter below and will explain why I personally think it's now Stage 1A.
Stage 1A - Start of a base. Needs much more time.
Stage 1 - Basing Phase. May begin accumulation.
Stage 1B - Late in base-building phase.Watch for breakout.
Stage 2A - Early in uptrend stage. Ideal time to buy aggressively.
Stage 2 - Advancing Stage
Stage 2B - Getting late in uptrend. Watch carefully. But still a hold.
Stage 3A - Looks as if a top is starting to form. Be sure to protect holdings with a close stop.
Stage 3 - The Top Area. Start to reduce positions.
Stage 3B - Has become increasingly toppy. Use rallies for at least partial selling.
Stage 4A - Stock has entered Downtrend Stage. Close out remaining positions.
Stage 4 - The Declining Stage. Avoid on the long side.
Stage 4B - Late in downtrend. Much too soon to consider buying.
Additional ratings
(A) Early in that Stage.
(B) Late in that Stage.
(+) Outstanding pattern in that Stage.
(–) Unexciting pattern in that Stage.
Below is the most recent interview with Stan Weinstein from 12th November 2011. The interview starts around 30 minutes into the recording.
Technician Stan Weinstein: Markets Still in Neutral Territory, Still Opportunities to Make Money Jim
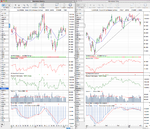
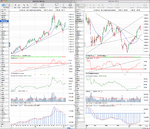
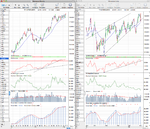
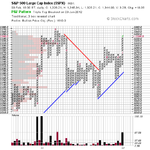
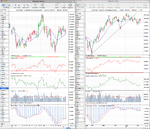
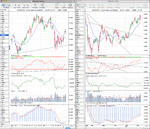
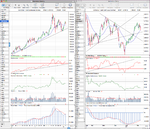
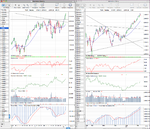
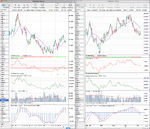
During the interview on 12th November Weinstein says the S&P 500 is in
Stage 4B- (Which from the definitions above is - Late in downtrend. Much too soon to consider buying. So it is eight weeks later now and the S&P 500 has since made two higher lows. The 30 week
weighted* moving average is flat as has been moving between up an down randomly for the last 8 weeks, with a total of 4 down weeks and 4 up weeks. Currently it has turned up for the last two weeks (see my chart attached). Price has broken out of and held above a 10 month down channel for the first time, although this was during the light volume year end week. Price has also managed to close above the flat 30 WMA for 5 weeks in a row now, so by my interpretation of the method and extrapolating from Stan Weinstein's own rating in early November I think we have now moved into Stage 1A, although it could deserve a minus rating as it is an unexciting pattern in that Stage. So I agree that this isn't a time to be buying or selling until the market moves into either a Stage 4 continuation move (below 1158 for me) or stabilises further into a proper Stage 1 - where he says you may begin accumulation.
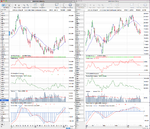
*The 30 week weighted moving average - from my study of the book I came to realise that even though he talks about the 30 week moving average. He was actually using the 30 week
weighted moving average, as that is what the Mansfield charts he uses for all of his actual examples uses. So this is one of those grey areas from the book that is open to interpretation. Currently if you use the 30 week simple moving average it is still in a downtrend although momentum has slowed. However if you use the weighted 30 week MA - as the Mansfield charts did - the MA has been flattening for the last 10 weeks and has turned slightly up for the last 2 weeks. So to be clear, I'm going to stick to using the weighted moving average as I think this the most faithful to real examples from the book.
As always this is just my opinion from my interpretation of it.
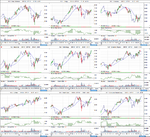
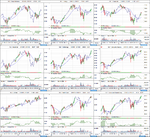
 SPX_weekly_27_1_12.png128.2 KB · Views: 396
 GC_weekly_27_1_12.png123.3 KB · Views: 357
 HG_weekly_27_1_12.png126.6 KB · Views: 589
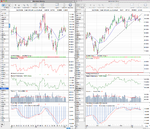 CL_weekly_27_1_12.png129.5 KB · Views: 339
 US30_treasuries_27_1_12.png129.7 KB · Views: 407
 DX_weekly_27_1_12.png124.7 KB · Views: 406
 TY_10yr_treasuries_27_1_12.png133 KB · Views: 400