Stan Weinstein's Stage Analysis

This website may help also to give specific ideas. Current Watch List from stocktiger.net Main Menu

Weinstein does not actually suggest looking for historical parallels. However, we all seem to do it - and come up with different answers!
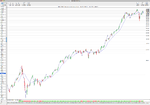
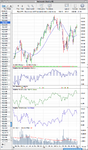
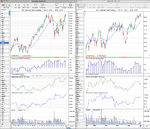
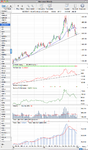
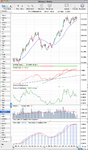
Stocktiger looks at a 5 year chart of SPX (monthly) and finds it reasonably bullish despite an uptrend break. http://stocktiger.net/newsletters/news030112.php
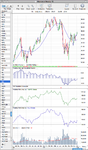
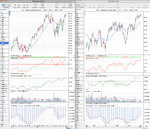
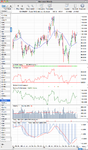
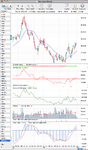
You have looked at a 2 year chart and find it reasonably bullish, and see perhaps current parallels with the "Stage 1" of around July 2010
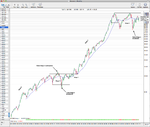
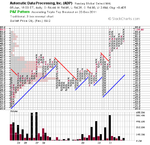
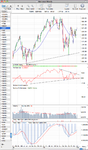
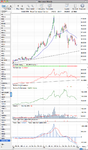
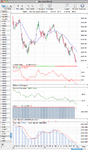
I looked at a 10 year chart and find it bearish, seeing only today's parallel to the stage 3/4 congestion around mid 2008. http://tinyurl.com/72adu5l

I like to draw historical parallels, and the more features you add to the description, the less likely you are to find a parallel. You have to select the few best features in order to find the best parallel. It's a problem !
 
S&P 500 All Years Chart

Here’s the S&P 500 quarterly chart since 1950 using a logarithmic scale. I’ve marked it up to show you what I’m seeing, as based on the price action this could possibly be the early part of a new Stage 1 formation on a quarterly basis. Or it could still be in Stage 3, but I think due to the failed Stage 4 breakdown in 2009 and two higher lows since then that it is actually now early in Stage 1 so could bounce around the 1000 to 1550 range for a few more years yet. But a break below 1000 would invalidate it.

For a historical comparison we only have the 1970's to look at on the S&P 500 of a similar consolidation period which took 5 years to resolve to the upside after the failed Stage 4 breakdown in 1974.

Below is my 61 year chart
 

Attachments

  • SPX_quarterly_all_years_mrk.png
    SPX_quarterly_all_years_mrk.png
    72.1 KB · Views: 379
Last edited:
Dow Industrials 91 Year Chart

Here's the logarithmic 91 year Dow Industrials chart which includes the 1920's and 1930's bull and bear market.
 

Attachments

  • INDU_quarterly_all_years.png
    INDU_quarterly_all_years.png
    78.1 KB · Views: 439
Sector rotation

It's only a few days into the new trading year but I've noticed a bit of sector rotation the last few days with last months leaders lagging so far. It's very early to tell if this is going to last but it is interesting none the less. I've attached last months chart and the first two days of this week for comparison.

The only two sectors in Stage 2 - Utilities and Consumer Staples have pulled back to their breakout levels. So we need to watch how they react here over the next few weeks and see if they form a continuation pivotal point and continue higher. As this would be a secondary low risk entry point if you missed the initial breakout points last month.
 

Attachments

  • Sectors_chart_20day_30-12-11.png
    Sectors_chart_20day_30-12-11.png
    14.2 KB · Views: 265
  • Sectors_chart_2day_4-1-12.png
    Sectors_chart_2day_4-1-12.png
    15.6 KB · Views: 264
  • US_industry_sectors_4-1-12.png
    US_industry_sectors_4-1-12.png
    139.5 KB · Views: 345
Last edited:
ADP - Automatic Data Processing

I normally wait for the confirmation of a stock closing the week above the Stage 2 buy point. However, my broker has finally added a boundary feature which means I can place my order properly as it is described in the book - with a buy stop order at the ideal entry point and price boundary limit a few ticks above so that if the price gaps above my limit price it won't be filled. So I've set my buy stop order price at 55.13 to 55.16 with a stop at 53.18 - which gives me a 2% ATR risk under the recent daily range if it is filled.

I like the relative performance on this stock which has been trending up for most of the year versus the market, it's industry sector and sub-sector. Volume is not there though so I will be looking to see if this picks up if it breaks out.

The Industry sectors is Industrials (XLI) which is shaping up nicely at the moment in Stage 1 and the Sub-sector is Financial Administration (^DJUSFA) which is in a similar Stage 1 pattern. Both of which are attached.

Below is my charts
 

Attachments

  • DJUSFA_weekly_RS_5_1_12.png
    DJUSFA_weekly_RS_5_1_12.png
    64.9 KB · Views: 219
  • XLI_weekly_RS_5_1_12.png
    XLI_weekly_RS_5_1_12.png
    61.2 KB · Views: 244
  • ADP_PnF_5-1-12.png
    ADP_PnF_5-1-12.png
    33.3 KB · Views: 229
  • ADP_weekly_RS_5_1_12.png
    ADP_weekly_RS_5_1_12.png
    123.1 KB · Views: 311
  • ADP_weekly_5_1_12.png
    ADP_weekly_5_1_12.png
    121.5 KB · Views: 354
Everyone who has read the whole thread and the book should be able to interpret a weekly chart by now fairly well, so attached is a handful of the major charts I look at each week for comparisons. I'd be interested to hear anyone's thoughts on what they are seeing with regards to the stages from these charts.
 

Attachments

  • SPX_weekly_6_1_12.png
    SPX_weekly_6_1_12.png
    60.5 KB · Views: 742
  • HG_weekly_6_1_12.png
    HG_weekly_6_1_12.png
    62.8 KB · Views: 313
  • CL_weekly_6_1_12.png
    CL_weekly_6_1_12.png
    65.5 KB · Views: 312
  • SI_weekly_6_1_12.png
    SI_weekly_6_1_12.png
    57.6 KB · Views: 318
  • GC_weekly_6_1_12.png
    GC_weekly_6_1_12.png
    56.1 KB · Views: 268
  • US-30-Year-Treasuries_6_1_12.png
    US-30-Year-Treasuries_6_1_12.png
    58 KB · Views: 288
  • TY-10-Year-Treasuries_6_1_12.png
    TY-10-Year-Treasuries_6_1_12.png
    58.5 KB · Views: 269
  • DX_Dollar_weekly_6_1_12.png
    DX_Dollar_weekly_6_1_12.png
    60.6 KB · Views: 260
  • SSEC_weekly_6_1_12.png
    SSEC_weekly_6_1_12.png
    56 KB · Views: 277
Last edited:
Strategy - Investor or Trader method

One thing I've been mulling over for a while now is the best way to use the method as although the initial entry points are the same for the investor and trader methods, that's where the similarity ends as the investor is looking to get in at the initial Stage 2 breakout point with a 50% position size and then watching for a volume build as the stock breaks higher over a number of weeks and then a volume decrease as the stock makes it's first major pullback towards the breakout level. If this is the case and other factors are still favorable then the investor purchases the second 50% of his position at this pullback to the breakout level and then rides the whipsaws until it enters Stage 3a. At this point half the position is taken off, leaving the other half position to ride through the Stage 3 consolidation with a stop loss at the Stage 4 breakdown point, so that the position will be exited fully if it breaks down to become a Stage 4 downtrend, but will still be in if it instead makes a Stage 2 continuation move higher. This can take many months or even years to play out, so the alternative is the trader method which favors buying continuation breakouts after a stock consolidates during a Stage 2 uptrend with a strongly trending higher 30 week moving average using a full position size and trying to time your exits with tighter stop losses and trend lines.

From what I've read I think I'm one of those people that could do a mix of both as I started as a long term investor and have gradually done more shorter term trading as I've experimented with different markets and tried to find my niche. Although I think I'll need to stick to one method per account. So the investor method in my ISA and the trader method in my CFD account.

My question though is one of strategy, as it's not clearly dealt with in the book (or maybe it is but it's late so if someone can point me to it that would be great). But I want to discuss how to manage your portfolio when the broad market is in a Stage 3 or Stage 1 consolidation period. As I think with the investor method it's more straightforward as you close half of your position when it enters Stage 3. So you can either keep that money on the side lines or you can use it to hedge your open positions. I know nothing about options personally, but I've read that one way to protect your open long positions is to sell a covered call (hopefully someone with experience of options can confirm this?). Or another way which I've been experimenting with is to trade both long and short positions during the base or top, giving your portfolio a more neutral direction bias during a consolidation period.

I'm guessing it would be different with the trader method though as you'd exit all of your position early in Stage 3, so would have all of your funds available to trade with. Would you trade both long a short stock positions or move into other markets altogether like I did in late April when I sold out of my stocks and moved into US treasuries. As there's usually a bull market somewhere. So when stocks are consolidating in Stage 3 or Stage 1 you could move to treasuries, commodities or currencies even, but I'd be interested to know peoples thoughts on this as I don't think portfolio strategy is discussed enough. Anyway I've rambled long enough tonight and need some sleep.
 
AAPL made a Stage 2 continuation breakout today with it making a new high. However, it didn't manage to close above the previous high. I prefer to wait for confirmation of a close above the high, so still on the watchlist for me.
 
Last edited:
Re: Strategy - Investor or Trader method

... how to manage your portfolio when the broad market is in a Stage 3 or Stage 1 consolidation period. As I think with the investor method it's more straightforward as you close half of your position when it enters Stage 3. So you can either keep that money on the side lines or you can use it to hedge your open positions.
In practice, what I think people would do if the relevant stockmarket index went into Stage 3, but you still had stocks in Stage 2 or Stage 3, is to run them until they meet the usual exit criteria, but not to add any new positions. Alternatively, stops could be tightened.

Weinstein's is a breakout method, so has no useful contribution on what to do when a stockmarket is going sideways (on a weekly chart basis).

As I read the book, the Trader method (i.e. using daily charts) is not an independent method, but is a means merely to spice up Stage 2 and Stage 4.
Weinstein's book is exclusively about picking the best stocks in a stockmarket. That makes sense, as at time of his writing there were no possibilities of retail trading in commodities and forex.
 
...attached is a handful of the major charts ... the stages from these charts.
Thanks for these isa. Just looking at the shapes without looking at the timeframe, they are most instructive. If you ask the questions 1. which charts have the simplest pattern and 2. which look to have the best entry points, the answers I think are: most like a stage 2 buy =DXY, and a stage 4 sell = GOLD, and a possible continuation stage 2 buy = Treasuries.
That result is an interesting test of discipline, as our observation might be that there is too much dollar bullishness at the moment, or that the dollar "has risen too much".
Waiting for a pullback to breakout line ( a bit like what silver has already done ) might be a practical opportunity to enter DXY or GOLD?
The other thing I notice is how good a signal indicator is the moving average.
On a 5 year chart it might all look different, of course !

I think you're a bit ahead of me on the stages for these. Dollar index I have as a Stage 1B as has significant resistance to overcome at 82.5 area, Gold I still make it Stage 3 until a good weekly close below the 3 year trend line and treasuries I still have as Stage 2B. So all of them are close to possible entry points, but aren't there yet imo. So we still need patience for the time being.
 
Re: Strategy - Investor or Trader method

In practice, what I think people would do if the relevant stockmarket index went into Stage 3, but you still had stocks in Stage 2 or Stage 3, is to run them until they meet the usual exit criteria, but not to add any new positions. Alternatively, stops could be tightened.

Weinstein's is a breakout method, so has no useful contribution on what to do when a stockmarket is going sideways (on a weekly chart basis).

As I read the book, the Trader method (i.e. using daily charts) is not an independent method, but is a means merely to spice up Stage 2 and Stage 4.
Weinstein's book is exclusively about picking the best stocks in a stockmarket. That makes sense, as at time of his writing there were no possibilities of retail trading in commodities and forex.

I agree, I guess I've just been trying to get my head around how best to manage a portfolio through the various market conditions and although the method in the book is solely about stocks. It's clear that it has applications for other markets as well.

I think the idea of hedging in Stage 3 or Stage 1 by shorting early stage 4 breakdowns or buying early stage 2 breakouts comes from the Jesse Livermore book I recently read which I believe Stan Weinstein's method is based on. So it is relevant I believe, but is not a pure application from the book itself.
 
I just had a quick scan through and in Chapter 9, page 330, he does actually talk about using it on other markets such as orange juice futures and mutual funds and index futures. So it wasn't limited to stocks only.
 
. . . . If you ask the questions 1. which charts have the simplest pattern and 2. which look to have the best entry points, the answers I think are: most like a stage 2 buy =DXY, and a stage 4 sell = GOLD, and a possible continuation stage 2 buy = Treasuries.
Again it shows how differently a chart can be interpreted! I was looking purely at the shape of the price close line, without opening the chart picture. I made the DXY breakout and MA turn up at 80 and the GOLD breakdown and MA turn down at around 1610. (Treasury still setting up for continuation Breakout.)
I was trying to take a dispassionate TA view, as on fundamentals I won't be taking these trades.
 
... other markets such as orange juice futures ...
Thanks isa I missed that. Nevertheless, the argument of the book to me says you need a relevant reference index and a set of individual instruments by which to cherry pick a new trend in that index.
Currencies, commodities and fixed interest may have a different cyclical nature to shares, so it needs testing of success and with different time frames. The book is based on many years' experience trend-trading shares only.

I think the forward testing in this thread of commodities and currencies has been promising so far using the same weekly time frame and the majority of the stage analysis methods. Although, due to the technical nature of the people trading currencies I think the monthly chart seems to give a clearer view on those, but weekly still works though too but is prone to bigger whipsaws. Treasuries on the other hand have shown some of the best examples of stage analysis. I agree you can't do everything you need to with Treasuries, like sector analysis. But that doesn't mean you can't trade them as from following them all while I've been doing this thread it is clear that the method works very well for all of them, and I'll continue to forward test them on here and you can make up your own mind from the results.
 
Last edited:
Top