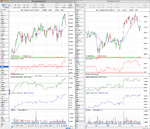
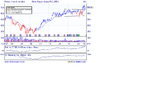
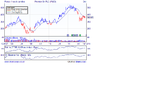
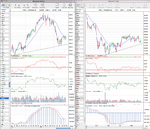
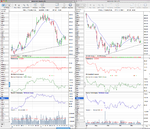
I noticed both of your picks are stocks that have fallen hard like the market has and so have resistance to fight through still. A big component of the method relative performance versus the market. You want to buy strength and sell weakness, so I'll give you an example of one of my current trades to illustrate this. The market trend was down when I bought this, so it breaks the rules a bit, but I think it's a good example of a good relative strength stock breaking out and currently retesting the breakout level. It might fail because the market is still negative, but has potential to move higher because of the size of the base and lack of resistance above it.