Stan Weinstein's Stage Analysis

thanks for your help today

No worries, thank you for getting involved. It's really helped me to talk about the concepts of Stans method today.

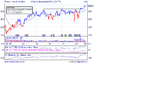
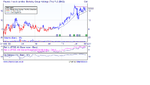
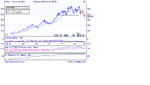
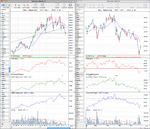
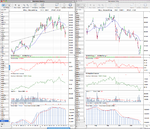
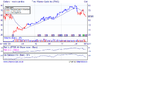
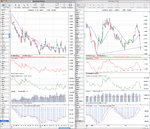
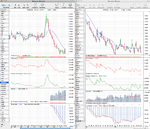
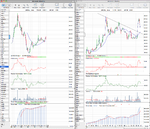
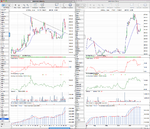
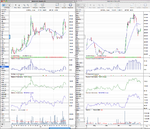
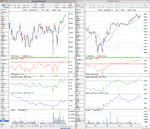
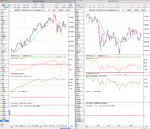
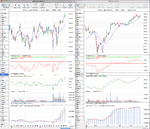
I did some scans on the FTSE 350 using a setting of the Mansfield relative strength above 0, outperformance vs the S&P 500 and a rising 30 week moving average. It produced about 20 stocks, but CHTR.L jumped out at me for several reasons. A question for you @theblackmamba if you want to, can you tell me what I like about CHTR.L charts attached? Maybe even mark them up if you want and repost them as I find it really helps me.

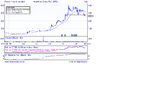
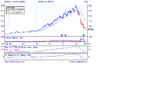
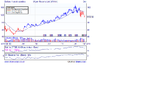
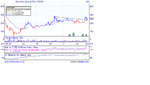
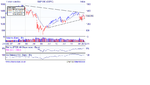
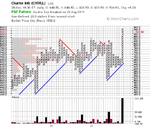
The point and figure chart might help you.
 

Attachments

  • CHTR_RS_weekly_28_11_11.png
    CHTR_RS_weekly_28_11_11.png
    115.6 KB · Views: 428
  • indust_eng_weekly_25_11_11.png
    indust_eng_weekly_25_11_11.png
    109 KB · Views: 400
  • CHTR_weekly2_28_11_11.png
    CHTR_weekly2_28_11_11.png
    117 KB · Views: 428
  • SharpChartv05-2.png
    SharpChartv05-2.png
    28.3 KB · Views: 419
Last edited:
1) industrial engineering is highest sector since oct low.
2) theres 2 years of no overhead stale holders.
3) high recent volume
3) on balance volume(i dont have your force) took off on breakout
4) outperformed mkt, and sector in last 6weeks.

must admit i cant see why u would buy at this particular time without a pb, as few weeks broken out.

be careful as i think in takeover talks or something....
 

Attachments

  • chtr.png
    chtr.png
    34.3 KB · Views: 446
1) industrial engineering is highest sector since oct low.
2) theres 2 years of no overhead stale holders.
3) high recent volume
3) on balance volume(i dont have your force) took off on breakout
4) outperformed mkt, and sector in last 6weeks.

must admit i cant see why u would buy at this particular time without a pb, as few weeks broken out.

be careful as i think in takeover talks or something....

Yep you got it, and I agree the breakout point was missed. So it's not a buy here, but the method says that the pullback is very important to watch as if the volume contracts when it decides to pullback and it holds above the breakout level then it would be a solid buy candidate with a lower risk entry point. So is one for the watchlist I think
 
another for the watchlist...lots clear air ahead...onbalvol not good at mo, but not broken yet so cant tell properly..
 

Attachments

  • bkg.png
    bkg.png
    34.1 KB · Views: 475
another for the watchlist...lots clear air ahead...onbalvol not good at mo, but not broken yet so cant tell properly..

It's a tricky one. Early Stage 3/ possible 2B as the moving average is still rising. Needs to breakout soon or the moving average will flatten and it'll be in Stage 3 properly.
 
these are the three potential shorts that got my interest today..
must admit with way market is at the moment i am wary of entering anything either long or short.. maybe should look of some comms or fx...
 

Attachments

  • mml.png
    mml.png
    32 KB · Views: 556
  • ipel.png
    ipel.png
    29.9 KB · Views: 542
  • mjw.png
    mjw.png
    32.7 KB · Views: 544
these are the three potential shorts that got my interest today..

MML.L looks the most interesting I think.

Entered Stage 4a on increasing volume
Relative strength is weak / sector is weak
Pullback to resistance yesterday was on light volume and selling off again today.
A close below 360 today needed I think.
First major support at 300
Risk/Reward seems good on daily. Less so on weekly which could bounce back up to 425 area.
First weekly entry point was missed.

must admit with way market is at the moment i am wary of entering anything either long or short.. maybe should look of some comms or fx...

I'm the same. So I'm keeping stops fairly tight and I took the EURGBP long term short on Sunday night that I laid out in the thread at the weekend as it's not as correlated to the stock market, so more of a relative strength play between the pound and the euro.
 

Attachments

  • MML_RS_weekly_28_11_11.png
    MML_RS_weekly_28_11_11.png
    115 KB · Views: 356
  • MML_weekly_28_11_11.png
    MML_weekly_28_11_11.png
    119.1 KB · Views: 363
Last edited:
with eur/gbp would you put stop apporox 0.885?

Depends on the timeframe. So mine is bigger as I'm using monthly timeframe with a lot less leverage, but that would be sensible on a weekly timeframe as it is above the last swing high and the 30 week MA.
 
jusy going through some us charts.. nflx is a good hindsight long then short.. those are the type of longs im dreaming about, and dia in uk..
 

Attachments

  • nflx.png
    nflx.png
    30.8 KB · Views: 344
EURAUD Stage Analysis

I been focusing on finding some long term trades that have less correlation to the market moves, and currencies seem to be a good option for this. Attached is the monthly, weekly and daily charts for the EUR/AUD forex pair.

On the monthly it's been in Stage 4 for the last few years. The weekly is in Stage 1 and near the low of the range, and on the daily it has broken it's trendline today after a big down move this week. As the move has been so big I'm going to watch to see what the reaction back up is first before taking a position as the 30 day MA is a long way behind at 1.3472 currently. But it looks like it might give a weekly stage 4 continuation signal by breaking below 1.29 soon.

Here's the charts
 

Attachments

  • EURAUD_daily_30_11_11.png
    EURAUD_daily_30_11_11.png
    123.7 KB · Views: 328
  • EURAUD_monthly_30_11_11.png
    EURAUD_monthly_30_11_11.png
    119 KB · Views: 372
A couple of my current trades are:

01/11/11 - RR.L long @ 678.85
24/11/11 - Silver short @ 32.009
25/11/11 - STI short @ 16.729
25/11/11 - RAI long @ 40.06

The current Weinstein method trades are doing ok. STI was stopped out yesterday for a -1.57% ATR(200) adjusted loss, but the longs are outperforming the shorts so is positive overall.

Open - RR.L currently @ 734
+3.13% ATR(200) adjusted

Open - Silver currently @ 33.2
-0.70% ATR(200) adjusted

Open - RAI currently @ 41.82
+2.59% ATR(200) adjusted

Closed - STI short @ 18.05
-1.57% ATR(200) adjusted (stopped out 30/11/11)

I'm going to continue to have a neutral directional bias for the time being as the S&P 500 is now in Stage 1 on the weekly chart. My current thinking is that a break above 1300 would be the Stage 2A breakout - so that would shift my bias to long only plays. But we are not there yet and could just as easily go the other way again.
 
Last edited:
nice one.. agree at this stage its best not to get carried away in either direction. must admit i am extremely light though.
only thing ive bought is eros below, which prob isnt a weinstein, but i liked the weekly break, and retracement back to breakout level, now going up again.
still watching berkely, but results on friday so will wait..
 

Attachments

  • eros.png
    eros.png
    34.2 KB · Views: 274
nice one.. agree at this stage its best not to get carried away in either direction. must admit i am extremely light though.
only thing ive bought is eros below, which prob isnt a weinstein, but i liked the weekly break, and retracement back to breakout level, now going up again.
still watching berkely, but results on friday so will wait..

Stage 1 on the weekly after a minor dip into Stage 4. Monthly shows it needs a close above 2010 high to hit Stage 2 breakout level. Relative performance vs the market and the media sector is good though, and a nice pop in volume. Here's the charts
 

Attachments

  • eros_monthly_30_11_11.png
    eros_monthly_30_11_11.png
    114.5 KB · Views: 327
  • eros_weekly_30_11_11.png
    eros_weekly_30_11_11.png
    116.3 KB · Views: 330
  • eros_rs_weekly_30_11_11.png
    eros_rs_weekly_30_11_11.png
    116.4 KB · Views: 372
Top