Stan Weinstein's Stage Analysis

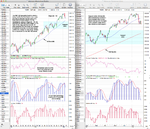
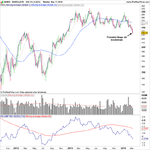
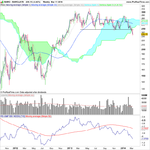
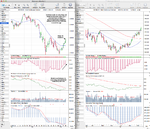
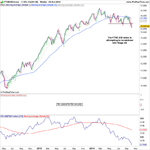
The vast majority of Stage 2A breakouts occur when the relative performance is above the zero line or on the week it crosses it. However, if the four key components of the method aren't all present - i.e. price action breakout, 2x volume, relative performance above zero line, above or moving above long term resistance - then avoid.

Hi.
In your last post, you explain the key components for a stage 2 break out. Could you explain the key components for stage 4 breakdown?
It will be much appreciated... Great little thread you got here
Thanks.
 
Hi.
In your last post, you explain the key components for a stage 2 break out. Could you explain the key components for stage 4 breakdown?
It will be much appreciated... Great little thread you got here
Thanks.

Thanks, it's simply the opposite of a Stage 2A breakout except on the volume. So you want to look for a price action breakdown, 2x average weekly volume (but less important than on breakouts), relative performance below zero line, and below or moving below long term resistance.

A current example of a stock in late Stage 3B is 888 Holdings, which is currently testing the bottom of it's Stage 3 range. The relative performance is below it's zero line, and volume has been above average this week so far. So if it breaks down and closes the week below it's support level then it would move into Stage 4A. However, it could also rebound at this point before making a Stage 2 continuation move higher, as it's a battleground area in a stock that had a very strong Stage 2 advance, so you would wait for confirmation of a breakdown before considering entering on the short side, as it may just be consolidating it's gains and trying to shake out the weak holders. But that's why you need confirmation imo.

attachment.php


I hope that helps
 

Attachments

  • 888-L_29-1-14.png
    888-L_29-1-14.png
    33.2 KB · Views: 2,174
Last edited:
NSR is an example of a Stage 4A breakdown for you, which I highlighted on Monday night in the watchlist thread http://stageanalysis.net/forum/showthread.php?tid=15&pid=2912#pid2912

attachment.php


View the marked up chart that I posted and then compare with the current chart, as it's a good example of why you shouldn't hold onto a stock moving into Stage 4A, as stocks often take the stairs up, but the elevator down, and is why one of Weinstein's rules from the book is that you should never go long a stock in Stage 3 or 4 (especially Stage 4).

attachment.php
 

Attachments

  • NSR_W_27-1-14.png
    NSR_W_27-1-14.png
    26.5 KB · Views: 1,619
  • sc-1.png
    sc-1.png
    26.4 KB · Views: 1,618
Last edited:
S&P 500 Stage Analysis

The S&P 500 has pulled back to retest a weekly swing low for the first time in over a year and in doing so has formed the first two parts of a potential head and shoulders pattern. So I’m changing my Stage rating to Stage 2B- / 3A, as although not officially yet in Stage 3A, it’s right on the edge of moving into Stage 3A and touched the 30 week weighted MA this week. So a weekly breakdown below the recent lows would confirm the change to early Stage 3A imo.

So it's a critical time for the S&P 500 ahead, although if it does breakdown then there should be some support at the 200 day MA were institutional investors / fund managers like to buy, which lines up with the highs of the summer range which also should provide some support. But if it rebounds here then the 50 day MA is the first hurdle imo.
 

Attachments

  • SPX_Weekly_31-1-14.png
    SPX_Weekly_31-1-14.png
    157.3 KB · Views: 431
Last edited:
Hello, thanks for answering my previous question. I am a complete begginer and probably have another stupid question lol. I was just wondering how do you find out if the market is in an upward trend/downward trend and how to find out what industries are the leaders on the FTSE in the most effective way? Thanks.
 
Hello, thanks for answering my previous question. I am a complete beginner and probably have another stupid question lol. I was just wondering how do you find out if the market is in an upward trend/downward trend and how to find out what industries are the leaders on the FTSE in the most effective way? Thanks.

I would suggest studying the book and learning how to identify the four major stages first, as once you can visually identify the four Stages you'll immediately be able to tell where in the cycle a stock is. i.e Stage 1 base, Stage 2 uptrend, Stage 3 top, Stage 4 downtrend etc. This is a very important first step to understand the method and will change the way you look at every chart once you learn.

As for finding out what industries are the leaders on the FTSE in the most effective way, I post weekly updates of the UK FTSE 350 sector relative performance tables on the new thread here: http://stageanalysis.net/forum/showthread.php?tid=1&pid=2971#pid2971 that ranks the sectors using the Mansfield Relative Performance figure, and also a UK Stocks - Watchlist and Discussion thread in another section here: http://stageanalysis.net/forum/showthread.php?tid=45 that I update daily.

I hope that helps.
 
Last edited:
I would suggest studying the book and learning how to identify the four major stages first, as once you can visually identify the four Stages you'll immediately be able to tell where in the cycle a stock is. i.e Stage 1 base, Stage 2 uptrend, Stage 3 top, Stage 4 downtrend etc. This is a very important first step to understand the method and will change the way you look at every chart once you learn.

As for finding out what industries are the leaders on the FTSE in the most effective way, I post weekly updates of the UK FTSE 350 sector relative performance tables on the new thread here: http://stageanalysis.net/forum/showthread.php?tid=1&pid=2971#pid2971 that ranks the sectors using the Mansfield Relative Performance figure, and also a UK Stocks - Watchlist and Discussion thread in another section here: http://stageanalysis.net/forum/showthread.php?tid=45 that I update daily.

I hope that helps.

Great stuff as usual Isa (y)
 
Yup agree.

I never read his book, but completely agree with his charting method, good and robust stuff !

170948d1391078594-stan-weinsteins-stage-analysis-888-l_29-1-14.png


Kinda Dow theory in action.

:)
 
Ah good ol Weinstein. I remember this as one of the first books I read on trading. The whole section about stage trading is one of the parts that has been most memorable for me. This and other general structure theories are always nice to keep in the back of your head and I always ask myself what my opinion is of the stage before i enter a trade
 
UK FTSE 350 Stocks and Sectors Relative Performance

Attached is the Relative performance tables for the UK FTSE 350 Sectors.

To see the individual stocks in each sector go to: http://www.londonstockexchange.com/...ndices.html?index=NMX&industrySector=&page=10 and use the drop down menu.

FTSE 350 Sectors - Ordered by Overall RS Score

FTSE350-Sectors-RS_21-2-14.png

FTSE 350 Sectors - Ordered by Weekly Change

FTSE350S_5Day_Change_21-2-14.png

FTSE 350 Sectors - Ordered by Monthly Change

FTSE350S_20Day_Change_21-2-14.png

Also, I've attached the weekly sector charts in order of their Overall RS Score
 

Attachments

  • FTSE350-Sectors-C1_21-2-14.png
    FTSE350-Sectors-C1_21-2-14.png
    95.3 KB · Views: 305
  • FTSE350-Sectors-C2_21-2-14.png
    FTSE350-Sectors-C2_21-2-14.png
    100.3 KB · Views: 259
  • FTSE350-Sectors-C3_21-2-14.png
    FTSE350-Sectors-C3_21-2-14.png
    100.9 KB · Views: 284
  • FTSE350-Sectors-C4_21-2-14.png
    FTSE350-Sectors-C4_21-2-14.png
    109.3 KB · Views: 268
  • FTSE350-Sectors-C5_21-2-14.png
    FTSE350-Sectors-C5_21-2-14.png
    33.3 KB · Views: 215
Last edited:
Hello again,
I finished his book and would say I have a fairy good understanding of the stage analyse, but am struggling to find the data/information needed to choose the correct stocks! as I'm in the UK and would like to use this strategy on the London stock market. Do you have any recommendations, could really use a hand right now!
Thanks.

There is a dedicated thread to discuss and create a watch list of UK stocks on isatrader's discussion forum dedicated to discussing Stan Weinstein's stage analysis method of trading and investing. He posts up on a daily basis stocks which meet the criteria to trade and invest using the method and also those that just fall short of the criteria for the watch list. You will also find advice on how to set up your own scans and helpfulness from isatrader and members on all aspects of the method. It is free to join and there is also an optional elite membership subscription. That is just a small taster of what is over there, I highly recommend you take a look.
 
BARC.L making a potential Stage 4A breakdown this week
 

Attachments

  • BARC-L_W_11-3-14.png
    BARC-L_W_11-3-14.png
    40.7 KB · Views: 338
BARC.L making a potential Stage 4A breakdown this week

Hi Isatrader,

I'm watching Barclays, and originally had 220 region as potential entry.

Just wondering if any support target is indicated with these breakdowns?
 
Hi Isatrader,

I'm watching Barclays, and originally had 220 region as potential entry.

Just wondering if any support target is indicated with these breakdowns?

No, I was highlighting it as it's cleared it's near term support levels and has very little resistance below now to support any fall in price if it does continue to breakdown into a full Stage 4 decline. The measured move from the Stage 3 range would be down to about 180, but it would be in a price discovery phase.

Attached is the weekly chart again, but with the weekly ichimoku cloud overlaid (not part of the method) which is a good way to visualize support and resistance zones, as it includes the effect of time on them.
 

Attachments

  • BARC-L_W_ich_11-2-14.png
    BARC-L_W_ich_11-2-14.png
    45.5 KB · Views: 321
Last edited:
Gold - Stage 2A breakout

Gold has made an early Stage 2A breakout this week, after only a very brief time in Stage 1. I emphasize the "early" as the Stage 1 base hasn't had time to develop, as it's traded straight through and so it hasn't had time to work off the Stage 4 declines resistance yet, and so could have some headwinds before a clearer chance at a Stage 2 advance.

Relative performance has been improving strongly since January, but it is still below a declining zero line currently, although if it continues to improve at the same rate then it will move above it in the coming weeks. Attached is the charts.
 

Attachments

  • GC_Weekly_14-3-14.png
    GC_Weekly_14-3-14.png
    133.4 KB · Views: 348
UK FTSE 350 Stocks and Sectors Relative Performance

Attached is the Relative performance tables for the UK FTSE 350 Sectors.

To see the individual stocks in each sector go to: http://www.londonstockexchange.com/...ndices.html?index=NMX&industrySector=&page=10 and use the drop down menu.

FTSE 350 Sectors - Ordered by Overall RS Score

FTSE350-Sectors-RS_25-7-14.png

FTSE 350 Sectors - Ordered by Weekly Change

FTSE350S_5Day_Change_25-7-14.png

FTSE 350 Sectors - Ordered by Monthly Change

FTSE350S_20Day_Change_25-7-14.png


As you can see from the relative performance tables above, Mining has been the strongest sector over the last week and month. So I've created a relative performance table for the FTSE 350 mining sector as well and ordered by the Mansfield RS reading. And I've also attached the weekly charts for the nine strongest in order.

As you can see there's been a few Stage 2A breakouts in the last week or so (KAZ.L, GLEN.L, BLT.L), and others in Stage 1 are close also (RRS.L, AAL.L)

PDL.L continues to be the strongest of the sector, making a fresh Stage 2 continuation over the last few weeks.

FTSE350-Mining_RS_25-7-14.png

FTSE350-Mining_25-7-14.png
 
Stage Analysis Study Guide and Checklist

I've added a few new threads to the Stage Analysis website recently to help people learn how to identify the Stage 2A breakouts with A+ potential that Stan Weinstein talks about in the book.

Here's the links:

Stage Analysis Study Guide - Questions and Answers - The purpose of the Study Guide is to help people learn to identify the Stages and to emphasize the importance of a full analysis taking into account the various technical attributes that we look to for guidance in determining the Stages i.e. price action in relation to the 10 and 30 week moving averages, volume, relative performance versus the market and the sector, support and resistance zones etc.

Stage Analysis Breakout Quality Checklist - The checklist is a step by step guide to the technical attributes that you should be looking for when trying to identify a Stage 2A breakout with A+ potential.
 
Ftse 250

The FTSE 250 index is attempting to breakdown into Stage 4A this week. Watching for a weekly close at or below these levels for confirmation of the Stage change.
 

Attachments

  • MCX-L_W_8-10-14.png
    MCX-L_W_8-10-14.png
    34 KB · Views: 269
  • MCX_D_8-10-14.png
    MCX_D_8-10-14.png
    40.7 KB · Views: 263
Top