isatrader
Senior member
- Messages
- 2,965
- Likes
- 136
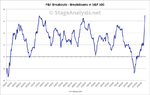
US Sector Breadth
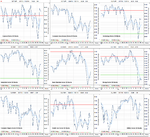
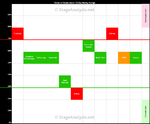
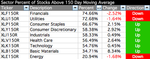
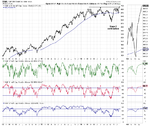
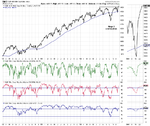
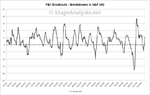
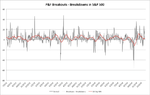
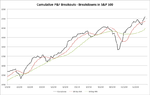
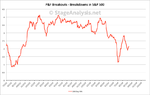
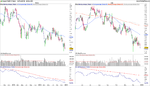
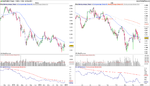
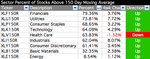
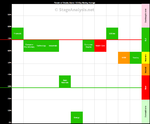
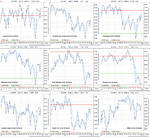
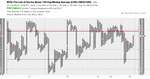
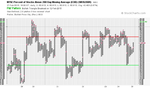
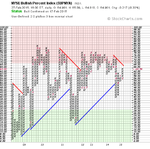
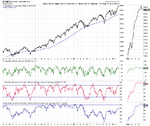
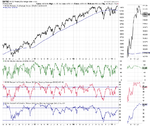
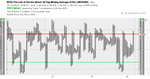
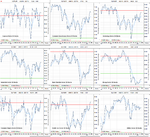
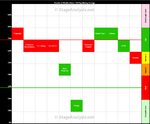
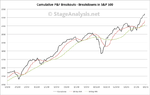
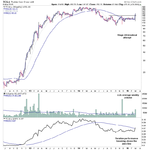
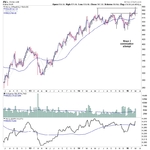
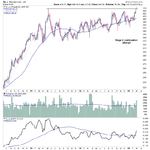
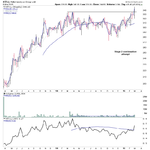
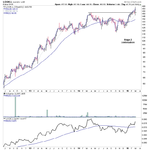
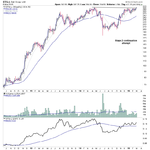
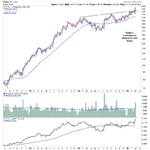
Below is the data table for the Percent of Stocks Above 150 Day Moving Average in each US sector, which I've ordered by relative strength, with the highest to the lowest percentage in each sector. Also attached is the visual diagram of the 9 sectors and the NYSE Percentage of Stocks above their 150 day Moving Averages line chart.

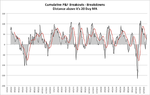
Note: The Basic Materials sector closed back above the key 30% level and so moves back to Bull Alert status.
Below is the data table for the Percent of Stocks Above 150 Day Moving Average in each US sector, which I've ordered by relative strength, with the highest to the lowest percentage in each sector. Also attached is the visual diagram of the 9 sectors and the NYSE Percentage of Stocks above their 150 day Moving Averages line chart.
Note: The Basic Materials sector closed back above the key 30% level and so moves back to Bull Alert status.