Stan Weinstein's Stage Analysis

I've had a look into an ISA on Sippdeal and also looked at trading actual stocks with Interactive Brokers. Both look good. I had a look at the demo on the ISA and there is a stamp duty to pay on top of the deal fee. I can't seem to see if this is the case with Interactive Brokers with trading actual stocks.

I will be looking at putting in £100 a month to begin with for a year or so to get used to it all as I don't mind losing that much. I won't reach the maximum ISA limit so both options are open to me but can't decide which would be cost effective. Does Interactive Brokers have other costs other than the flat fee of £6 per trade?

Any advice or guidance?

That's far too little money for trading real stocks. With fees of around £10 per side on the average ISA account plus stamp duty on all UK stocks, you need to be doing at least £1000 per trade. Ideally more. So if what you said is all the capital you've got for it then spread betting is your only option for live trades. Or you might be better off demo trading while you learn, as being under capitalized will just make it that much harder.

Also, you need a minimum of around $10,000 to open an Interactive Brokers account I think the last time I looked.
 
Last edited:
Thanks for the heads up! :) I might just have to get back to spread betting for now then. I think I'll have to go back to IG Index. I've always seen spread betting as a short term trade platform. Any thoughts?

I'll have to give it a go for medium and long term and see how that pans out for now.
 
Thanks for the heads up! :) I might just have to get back to spread betting for now then. I think I'll have to go back to IG Index. I've always seen spread betting as a short term trade platform. Any thoughts?

I'll have to give it a go for medium and long term and see how that pans out for now.

Your intentions might be to be a medium to long term trader, but if you are only just getting started then you'll find that you'll probably close out a lot of your trades much earlier, as it's hard to hold onto a stock in a Stage 2 advance through the numerous pullbacks and sideways consolidations that can last many months. So the cheapest way will likely be to use the daily funded bet on IG, instead of the quarterly's, as the fee is already built into the quarterly's spread when you start. Whereas with the daily funded bet it's only applied on a daily basis and doesn't become more expensive than the initial quarterly's spread for a good few months. A member on my Stage Analysis site trades this way and worked out the cost a while ago to be better. So that's what I'd suggest to begin with as minimizing your trading costs is very important.
 
Last edited:
Your intentions might be to be a medium to long term trader, but if you are only just getting started then you'll find that you'll probably close out a lot of your trades much earlier, as it's hard to hold onto a stock in a Stage 2 advance through the numerous pullbacks and sideways consolidations that can last many months. So the cheapest way will likely be to use the daily funded bet on IG, instead of the quarterly's, as the fee is already built into the quarterly's spread when you start. Whereas with the daily funded bet it's only applied on a daily basis and doesn't become more expensive than the initial quarterly's spread for a good few months. A member on my Stage Analysis site trades this way and worked out the cost a while ago to be better. So that's what I'd suggest to begin with as minimizing your trading costs is very important.
isatrader is right, but you are asking basic questions. You should read up in general, and, on he strategy itself, in the book and on this rich thread on t2w and also join isa's new website. That will take you a year at least. With such small £ I suggest you consider actual trading only on the FTSE (or its etf) or else on a tracker or suitable investment trust. This should mean you incur trading costs, whether brokerage or spread costs, only 2-3 times a year.
 
isatrader is right, but you are asking basic questions. You should read up in general, and, on he strategy itself, in the book and on this rich thread on t2w and also join isa's new website. That will take you a year at least. With such small £ I suggest you consider actual trading only on the FTSE (or its etf) or else on a tracker or suitable investment trust. This should mean you incur trading costs, whether brokerage or spread costs, only 2-3 times a year.

Thanks for the advice. I'll get reading. So you think I should open an account with Sippdeal as an ISA account? I can spare £100 a month at the moment for about a year then I can hopefully put in more. This is going to sound like a basic question but can you trade the FTSE? As in buy shares in the FTSE100?

I know you can spreadbetting but don't know about buying actual shares.

With that amount of money, you wouldn't be able to "trade" as it's far too little money, but you could set up direct debit into a what is called a regular investment into a FTSE fund, that aims to track the performance of the FTSE 100. And you can find lots of info about this on Selftrade, Sippdeal or any of the other major ISA providers websites.

Ok, lets get the thread back on track please, as it's going way off topic.
 
It's been a while since I last posted the updated major equity index charts and relative performance table on t2w, as I post them every week now on the Stage Analysis website, along with the market breadth charts to help determine the current Stage of the market through the weight of evidence.

attachment.php


US Stock Indexes

SPX_Weekly_8-11-13.pngIXIC_Weekly_8-11-13.pngIWM_Weekly_8-11-13.pngNYA_Weekly_8-11-13.png

European Stock Indexes

DAX_Weekly_8-11-13.pngFTSE100_Weekly_8-11-13.png
 

Attachments

  • Major_Charts_RS_list_8_11_13.png
    Major_Charts_RS_list_8_11_13.png
    25.2 KB · Views: 1,066
Commodities Update and the Dollar Index

Attached is the updated major commodities charts, Gold (GC), Copper (HG), West Texas Intermediate Crude (CL) and the Dollar Index (DX).
 

Attachments

  • DX_Weekly_8-11-13.png
    DX_Weekly_8-11-13.png
    138.1 KB · Views: 218
  • CL_Weekly_8-11-13.png
    CL_Weekly_8-11-13.png
    137.2 KB · Views: 197
  • HG_Weekly_8-11-13.png
    HG_Weekly_8-11-13.png
    136.7 KB · Views: 202
  • GC_Weekly_8-11-13.png
    GC_Weekly_8-11-13.png
    128.4 KB · Views: 225
US 10 & 30 Year Treasuries

Attached is the updated US 10 & 30 Year Treasuries charts.
 

Attachments

  • TY_10yr_Treasuries_8_11_13.png
    TY_10yr_Treasuries_8_11_13.png
    130.4 KB · Views: 308
  • US_30yr_Treasuries_8_11_13.png
    US_30yr_Treasuries_8_11_13.png
    130.4 KB · Views: 272
US Industry Sectors

Attached are the updated US Major Sector Charts and relative performance table.

attachment.php
 

Attachments

  • US_Industry_Sectors_8_11_13.png
    US_Industry_Sectors_8_11_13.png
    116.5 KB · Views: 306
  • US_Industry_Sectors_D_8_11_13.png
    US_Industry_Sectors_D_8_11_13.png
    113.8 KB · Views: 291
  • US_Industry_Sectors_list_8_11_13.png
    US_Industry_Sectors_list_8_11_13.png
    20.3 KB · Views: 1,317
Market Breadth Update

Attached is the updated NYSE Bullish Percent Index and the NYSE long, medium and short term moving average breadth charts, the advance decline line and the new high new lows.

attachment.php


The NYSE Bullish Percent Index

$BPNYA_8-11-13.png

NYSE Percentage of Stocks above their 200 Day, 150 Day and 50 Day Moving Averages P&F charts

NYA200R_8-11-13.pngNYA150R_8-11-13.pngNYA50R_8-11-13.png

NYSE Percentage of Stocks above their 200 Day, 150 Day and 50 Day Moving Averages line charts

NYA200R_line_8-11-13.pngNYA150R_line_8-11-13.pngNYA50R_line_8-11-13.png

Advance Decline Line

NYAD_Cum_8-11-13.png

New Highs New Lows

NYHL_D_8-11-13.png
 

Attachments

  • market-breadth-table_8-11-13.png
    market-breadth-table_8-11-13.png
    23.5 KB · Views: 2,293
Stage 2 Continuation Example

attachment.php


I wanted to highlight TASR, as it shows a good example imo of a Stage 2 continuation move over the last few months to new highs, following a consolidation of it's initial Stage 2 run up. Volume surged to more than two times the weekly average on the continuation breakout and the relative performance also broke out to new highs. But another thing to note that we haven't talked about much before was the Volatility Contraction Pattern (VCP) before the breakout to new highs, which was accompanied by a volume contraction immediately preceding the Stage 2 continuation move.

The Volatility Contraction Pattern (VCP) is a core concept of Mark Minervini's work, who uses Weinstein's method as well as Jesse Livermore's work and fundamentals also, and has had great success over the years and featured in the Stock Market Wizards book. I recently read Mark Minervini's book "How to Achieve Super Performance in Stocks in Any Market" and think it's an excellent companion for people using Weinstein's trader method as it has some additional depth for shorter term traders as Weinstein's book was more focused on the investor method. But the concepts it introduces can be used by both traders and investors imo, so I'd recommend it for everyone using Weinstein's method.
 

Attachments

  • TASR_W_1-11-13.png
    TASR_W_1-11-13.png
    25.4 KB · Views: 2,188
New here - Stan Weinstein fan

Hi all,

I've been a Stan's fan for the last 15 years. Do you know which screener to use to find companies that match his strategy?

Thanks.
 
Hi all,

I've been a Stan's fan for the last 15 years. Do you know which screener to use to find companies that match his strategy?

Thanks.

There's a few useful free screeners that can be set to find some the characteristics that we look for in the method - Finviz, Chartmill and Prorealtime are all good. And a fairly good starting place is to just run a simple screen to look for at least two times the weekly average volume and a rising 30 week MA, and then go through the results manually to find the most suitable candidates for further research. Or if you want to check daily then screen for three times the daily average volume and rising 30 week MA.
 
There's a few useful free screeners that can be set to find some the characteristics that we look for in the method - Finviz, Chartmill and Prorealtime are all good. And a fairly good starting place is to just run a simple screen to look for at least two times the weekly average volume and a rising 30 week MA, and then go through the results manually to find the most suitable candidates for further research. Or if you want to check daily then screen for three times the daily average volume and rising 30 week MA.

Thanks for the heads-up on Chartmill - they have some great parameters to screen for. Do you think it would help to screen for the price near lows as well?

I've been a CANSLIM guy, but I think this method has the potential to get in much earlier for a bigger chunk of the runup, although bottoms are difficult to pinpoint. I'm fond of buying the first bounce off the 50 day MA after a first move up. I actually bought Stan's book in the 90's and have been trying to find it somewhere around here......

Thanks for all your work in this thread - it hasn't gone unnoticed!
 
Last edited:
Thanks for the heads-up on Chartmill - they have some great parameters to screen for. Do you think it would help to screen for the price near lows as well?

I've been a CANSLIM guy, but I think this method has the potential to get in much earlier for a bigger chunk of the runup. I'm fond of buying the first bounce off the 50 day MA after a first move up. I actually bought Stan's book in the 90's and have been trying to find it somewhere around here......

Thanks for all your work in this thread - it hasn't gone unnoticed!

No, stay away from looking for price near the lows in the screens, as an early Stage 2A breakout doesn't happen very near the low percentage wise as Stage 1 bases can be quite wide. Volume is the key ingredient to screen for imo as well as a rising 30 week MA. So learn to be able visually identify the Stage 2A breakout point and then when you go through your screen results you be able to narrow it down quickly.

I do a few watchlist threads on my Stage Analysis forum, so if you want to see the more up to date stuff I've been doing then search for that via Google.
 
The key points that I learnt in 2013 about Stan Weinstein's method.

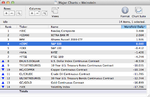
Volume is just as important today as it was back when Weinstein wrote the book. We had discussed on this old thread and earlier in the year whether volume was as important anymore due to indexing, ETFs and dark pools etc. But through the course of doing the Stage Analysis forum and the daily scans for breakouts and breakdowns etc I've come to realise that it's just as important today as it was back then, it's just only visible mostly the small caps that aren't distorted by the indexing etc.

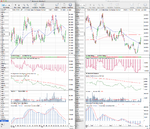
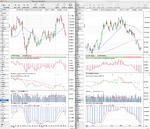
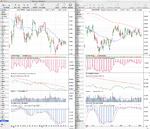
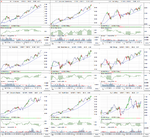
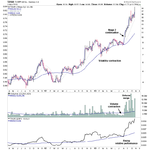
The vast majority of Stage 2A breakouts occur when the relative performance is above the zero line or on the week it crosses it. However, if the four key components of the method aren't all present - i.e. price action breakout, 2x volume, relative performance above zero line, above or moving above long term resistance - then avoid.

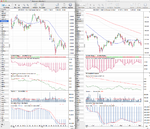
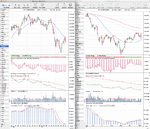
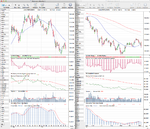
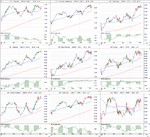
The Relative Performance Zero Line (52 week moving average of the stock divided by the S&P 500) is a useful guide as to whether a Stage 2A breakout will be successful or not. The Mansfield RS flattened the zero line, but by viewing the unflattened MA you can get additional vital information as to whether it's too early for a stock to breakout or not successfully. As I've noticed through the hundreds of charts I look at daily that if the zero line is still declining sharply when the Stage 2A breakout occurs, that the stock will struggle to advance. It doesn't mean that it won't advance, but that the most successful Stage 2A breakouts occur when the zero line is either flattening or already moving higher.

Never to buy a breakout trading under heavy / any near term resistance. I define this using the weekly Ichimoku Cloud as I can instantly see the resistance then when scanning through the charts each day and filter out any setups that aren't ready and will need more time to work through the resistance first. Any that aren't ready can be put on a longer term watchlist that can be reviewed occasionally for if and when they are ready to clear resistance.

A+ setups occur regularly in the small/mid caps but are rare in the large cap stocks. So you should never compromise in the small and mid cap stocks - remember the excerpt about opportunity cost from the book.

Moving on to 2014 - the last year in the market was very strong by historical standards and a lot of traders will be patting themselves on the back for doing so well as so many stocks went up, and so it's easy to get complacent. But we never know whats going to happen next in the market, and with the US markets continuing in Stage 2B currently we need to continue to focus, especially on the quality of trades we now make, and also on the stocks already in our portfolios, as they are the best guide to whats really happening in the market imo, along with the market breadth data.

Good luck with your trading and investing in 2014, and please try to get involved with the new Stage Analysis website if you use Stan Weinstein's method, even if only in a small way.

Happy New Year
 
Last edited:
Top