Stan Weinstein's Stage Analysis

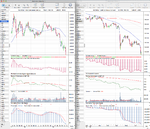
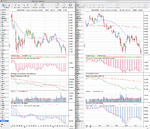
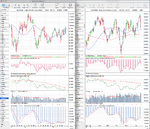
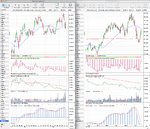
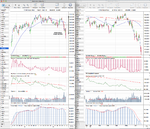
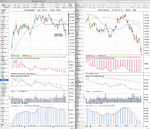
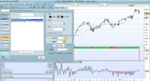
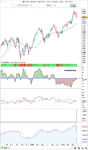
Commodities Update and the Dollar Index

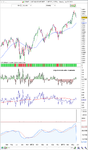
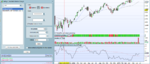
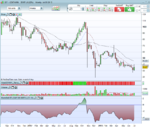
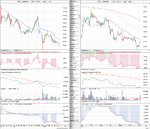
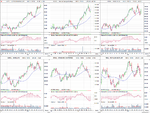
Attached is the updated major commodities charts, Gold (GC), Copper (HG), West Texas Intermediate Crude (CL) and the Dollar Index (DX).
 

Attachments

  • GC_Weekly_21-6-13.png
    GC_Weekly_21-6-13.png
    125 KB · Views: 393
  • HG_Weekly_21-6-13.png
    HG_Weekly_21-6-13.png
    132.2 KB · Views: 302
  • CL_Weekly_21-6-13.png
    CL_Weekly_21-6-13.png
    147 KB · Views: 339
  • DX_Weekly_21-6-13.png
    DX_Weekly_21-6-13.png
    134.7 KB · Views: 325

Attachments

  • TY_10yr_Treasuries_21_6_13.png
    TY_10yr_Treasuries_21_6_13.png
    130.9 KB · Views: 329
  • US_30yr_Treasuries_21_6_13.png
    US_30yr_Treasuries_21_6_13.png
    136.3 KB · Views: 316
UK FTSE 350 Stocks and Sectors Relative Performance

Below is the updated the weekly FTSE 350 stocks and sectors relative performance tables

FTSE 350 Sectors by Overall RS Score

FTSE350-Sectors-RS_21-6-13.png

Top 50 FTSE 350 Stocks by Overall RS Score

FTSE350_RS_top50_21-6-13.png

Also attached below is the biggest moving FTSE 350 stocks since last week by their Mansfield Relative Performance figures.

FTSE 350 Gainers

FTSE350_RS_top35_21-6-13.png

FTSE 350 Fallers

FTSE350_RS_bot35_21-6-13.png

To view the entire FTSE 350 stocks in the spreadsheet click the following link: FTSE 350 Stocks RS.xlsx and use the tabs at the bottom to see the different views by overall relative strength or by weekly RS change.
 
Thanks for posting up the new charts, isatrader.

I'm currently trying to see if I can align my charts up in a similar way to how you have them setup in the charts you post.

If we take one of yours for example, concentrating only on the weekly aspect, and just looking at the 'Relative Performance vs S&P 500 (52W MA baseline)'...
http://www.trade2win.com/boards/att...steins-stage-analysis-ixic_weekly_21-6-13.png

...I can't quite match it up if you look at my Mansfield RS indicator in the attached image. You can also see the Mansfield RS settings dialog open to see what settings I have.

Mine certainly looks a lot more choppy. Not sure if this is just the way that ProRealTime renders it or whether I have a setting or two wrong.

What multiplier do you use for your Mansfield RS chart

Also, on the weekly are your charts set to 100 units on the weekly?

Thanks in advance
 

Attachments

  • RelativePerformance_1.png
    RelativePerformance_1.png
    118.8 KB · Views: 307
What multiplier do you use for your Mansfield RS chart

You want to use 52 weeks, with a 10 Multiplier.

The reason for the differences on the charts is that in ProRealTime in the Options menu you have the Adjust Historical Data set to "After dividends, for stocks". This affects the relative performance as indexes shouldn't be adjusted, only stocks and ETFs should. So if you untick this in the options menu it will look closer to my chart software's version. I have attached both versions with the option unticked and ticked.

I hope that helps
 

Attachments

  • COMP_data_unadjusted_21-6-13.png
    COMP_data_unadjusted_21-6-13.png
    41.9 KB · Views: 315
  • COMP_data_adjusted_21-6-13.png
    COMP_data_adjusted_21-6-13.png
    50.2 KB · Views: 319
thanks isatrader, playing with that 'after dividends, for stocks' smooths it out nicely :) Although it does keep changing the indicator when I switch between stocks and indexes...i'll get to the bottom of it :)

With your other indicator 'Relative Performance vs SP 500'. What multiplier are you using to get the left-hand graph values and also what value of the MA is applied?

Can I ask you why you have two Mansfield charts which are quite similar? What does one tell you over the other?
 
Hi tryst, I'm on holiday this week, so apologies for the slow reply. The reason for the two relative performance charts is for a couple of reasons. The second chart below is the straight relative performance. i.e. the stock divided by the S&P 500 with a 52 week moving average. So it is identical to the Mansfield relative performance version above it, but the 52 week ma is the zero line in the Mansfield version. So I find it useful as the slope of the 52 week ma gives you extra information about the relative performance strength, as if it's still in strong downtrend when it breaks above the 52 week ma (zero line) then there's a higher risk of it not getting very far, as it often still needs more time for sentiment to change from my observations. So a flattening slope on the zero line is something I personally am looking for as well as the stock breaking above it and starting to outperform the market, as I believe this gives a stronger more stable base to breakout from.

So use the straight relative performance with the 52 week ma if you want less on the chart, like on the stockcharts charts that I post, as it gives you more information than if you only use the Mansfield version imo.
 
Last edited:
Hi Isatrader, thanks for getting back to me and sorry to disturb you whilst on holiday. Hope you had a good holiday.

Sorry about not replying sooner, I have only just had the chance to catch up with this.

What I currently have for the 2nd Relative Performance indicator is attached. I basically took the (Relative Performance Vs S&P - 52W MA baseline) and changed some settings. I have the numeric figures on the right-hand side way off, and the MA doesn't quite look right.

Thanks in advance
 

Attachments

  • Relative_Performance.png
    Relative_Performance.png
    88.6 KB · Views: 318
Hi Isatrader, thanks for getting back to me and sorry to disturb you whilst on holiday. Hope you had a good holiday.

Sorry about not replying sooner, I have only just had the chance to catch up with this.

What I currently have for the 2nd Relative Performance indicator is attached. I basically took the (Relative Performance Vs S&P - 52W MA baseline) and changed some settings. I have the numeric figures on the right-hand side way off, and the MA doesn't quite look right.

Thanks in advance

Yep, the holiday was good thanks. Went to Lake Como in Italy which is stunning to say the least, so had a very good time.

The indicator to use in ProRealTime for the straight relative performance versus the S&P 500 is called "Relative Strength (Comparision)" in the drop down menu of indicators. So select that one, then add the 52 week MA to that, and it will then look the same as what I showed, as it looks like you've added a 52 week MA to the Mansfield RS instead.

An easy way to check that it's correct is to have the correct weekly Mansfield indicator showing and then add the Relative Strength (Comparision) indicator below and add the 52 week MA, as you can then compare the zero line crosses to the crosses of the Relative Strength line over and under it's 52 week MA.
 
Below is the updated the weekly FTSE 350 stocks and sectors relative performance tables

FTSE 350 Sectors by Overall RS Score

FTSE350-Sectors-RS_28-6-13.png

Top 50 FTSE 350 Stocks by Overall RS Score

FTSE350_RS_top50_28-6-13.png

Also attached below is the biggest moving FTSE 350 stocks since last week by their Mansfield Relative Performance figures.

FTSE 350 Gainers

FTSE350_RS_top35_28-6-13.png

FTSE 350 Fallers

FTSE350_RS_bot35_28-6-13.png

To view the entire FTSE 350 stocks in the spreadsheet click the following link: FTSE 350 Stocks RS.xlsx and use the tabs at the bottom to see the different views by overall relative strength or by weekly RS change.
 
Yep, the holiday was good thanks. Went to Lake Como in Italy which is stunning to say the least, so had a very good time.

The indicator to use in ProRealTime for the straight relative performance versus the S&P 500 is called "Relative Strength (Comparision)" in the drop down menu of indicators. So select that one, then add the 52 week MA to that, and it will then look the same as what I showed, as it looks like you've added a 52 week MA to the Mansfield RS instead.

An easy way to check that it's correct is to have the correct weekly Mansfield indicator showing and then add the Relative Strength (Comparision) indicator below and add the 52 week MA, as you can then compare the zero line crosses to the crosses of the Relative Strength line over and under it's 52 week MA.

Ah, nice. Would like to go to Lake Como myself one day.

Thanks for explaining the relative strength indicator, I have it set up correctly now.

Thanks again
 
This thread and the market breadth thread are amazing. I have been eagerly reading them and learning as much as I can. Very interesting stuff! Going to buy Stan Weinsteins book asap.
 
UK FTSE 350 Stocks and Sectors Relative Performance

Below is the updated the weekly FTSE 350 stocks and sectors relative performance tables

FTSE 350 Sectors by Overall RS Score

FTSE350-Sectors-RS_5-7-13.png

Top 50 FTSE 350 Stocks by Overall RS Score

FTSE350_RS_top50_5-7-13.png

Also attached below is the biggest moving FTSE 350 stocks since last week by their Mansfield Relative Performance figures.

FTSE 350 Gainers

FTSE350_RS_top35_5-7-13.png

FTSE 350 Fallers

FTSE350_RS_bot35_5-7-13.png

To view the entire FTSE 350 stocks in the spreadsheet click the following link: FTSE 350 Stocks RS.xlsx and use the tabs at the bottom to see the different views by overall relative strength or by weekly RS change.
 
Hi isatrader, hope your weekend is going well. Amazing weather down in Wales today, but not really up to much to take advantage of it.

With the charts you submitted in your last post. The stocks based on the weekly Mansfield Relative Performance Figures. Are these based against the S&P 500?

Taking Centamin for example, how do you get the values for each column? (i.e. -44.391, -49.76 and -41.979)?

If you look at my attached weekly chart of Centamin which has a Mansfield Relative Strength against the S&P 500, you will see the vertical axis graph values on my chart our not inline. Is it a rounding issue on my charts? (for example the current value is showing -4.5634)

Thanks
 

Attachments

  • Centamin.png
    Centamin.png
    65.6 KB · Views: 295
Hi isatrader, hope your weekend is going well. Amazing weather down in Wales today, but not really up to much to take advantage of it.

With the charts you submitted in your last post. The stocks based on the weekly Mansfield Relative Performance Figures. Are these based against the S&P 500?

Taking Centamin for example, how do you get the values for each column? (i.e. -44.391, -49.76 and -41.979)?

If you look at my attached weekly chart of Centamin which has a Mansfield Relative Strength against the S&P 500, you will see the vertical axis graph values on my chart our not inline. Is it a rounding issue on my charts? (for example the current value is showing -4.5634)

Thanks

For the weekly tables I post I have to use daily values, as my software can only do daily figures in the portfolio section it's created in. So I use the Mansfield 200 day MA relative performance figures instead, which is the standard figure on the daily chart. So it's a bit faster than the 52 week MA, that would be closer to 253 trading days.

The reason my data points are -41.979 and yours are -4.5634 is that in my ProTA software I use a 100 multiplier on the Mansfield chart instead of the 10 multiplier that ProRealTime had by default. So it's the same data, but it just gives you a larger figure.

Let me know if that doesn't make sense.
 

Attachments

  • CEY-L_Weekly_5-7-13.png
    CEY-L_Weekly_5-7-13.png
    89.5 KB · Views: 288
For the weekly tables I post I have to use daily values, as my software can only do daily figures in the portfolio section it's created in. So I use the Mansfield 200 day MA relative performance figures instead, which is the standard figure on the daily chart. So it's a bit faster than the 52 week MA, that would be closer to 253 trading days.

Let me know if that doesn't make sense.

Thanks, isatrader. Got it sorted now.

In ProTA you can set up your portfolios to have a column which lists the daily Mansfield 200 MA relative performance figures? That is cool if is the case, instead of having to open up each company in your portfolio to get the value.
 
Thanks, isatrader. Got it sorted now.

In ProTA you can set up your portfolios to have a column which lists the daily Mansfield 200 MA relative performance figures? That is cool if is the case, instead of having to open up each company in your portfolio to get the value.

Yep, you can bring up a column of any indicators values for each stock - even custom indicators that you create yourself, and so is very useful and one of the major reasons for me using the software as it gives me the ability to create the relative performance tables quickly.

It is possible to do in ProRealTime as well I believe, as you can do it for standard indicators like the RSI easily (see page 16 of the following link to the programming pdf: https://www.prorealtime.com/en/pdf/proscreener.pdf), but for a custom indicator like the Mansfield Relative Performance it's more tricky and I haven't been able to code it as yet, so if someone else can work it out then that would make ProRealTime much more useful.
 
Last edited:
Focus On: UK Bank Sector - NMX8350

Attached are the charts for the UK Bank Sector (NMX8350) and the relative performance table in order of strength.

The rest of the major weekly charts are on the other Stage Analysis thread as usual.

attachment.php
 

Attachments

  • FTSE_350_Banks_5-7-13.png
    FTSE_350_Banks_5-7-13.png
    15.3 KB · Views: 1,509
  • FTSE_350_Banks_W_5-7-13.png
    FTSE_350_Banks_W_5-7-13.png
    97.6 KB · Views: 290
Last edited:
Yep, you can bring up a column of any indicators values for each stock - even custom indicators that you create yourself, and so is very useful and one of the major reasons for me using the software as it gives me the ability to create the relative performance tables quickly.

It is possible to do in ProRealTime as well I believe, as you can do it for standard indicators like the RSI easily (see page 16 of the following link to the programming pdf: https://www.prorealtime.com/en/pdf/proscreener.pdf), but for a custom indicator like the Mansfield Relative Performance it's more tricky and I haven't been able to code it as yet, so if someone else can work it out then that would make ProRealTime much more useful.

Thanks, Isatrader. I will have a look at this document. I am a software engineer in my day job, so don't mind getting my hands dirty with some programming.

I am also in contact with their support team in ProRealTime so can pick their brains also.

When you say...

It is possible to do in ProRealTime as well I believe, as you can do it for standard indicators like the RSI easily, but for a custom indicator like the Mansfield Relative Performance it's more tricky.

...isn't the Mansfield Relative Performance a standard indicator in ProRealTime?
 
Top