Skim, what do you think of this?

I find it best just to stick to one market, and only trade what you see happening on that market. If you are looking at one and expecting the other to follow, then you're just making your life more difficult. Only time will be able to tell you whether you are better off just looking at the FTSE and ignoring everything else, or not. The times of the figures announcements, are the only things I would note because there can often be significant moves, as you know.

Once you get into the swing of trading like this, you will realise that actually the figures are known in the market, and the price bars are reflecting it. Interest rate announcements do not apply!

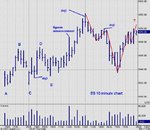
I do, however, look at the Dow just occasionally - sometimes a pattern is clearer on one or the other. But 99% of the time I am only concerned with the ES.
 
It's funny, but the minute that you think you have something cracked, the market comes and gives you a bit of a spanking. :cheesy:

It's her way of telling you that you haven't, and you need to spend more time on the homework.

On chop suey days like today so far, once you are in a position it's safest to jump ship with 1.5 or 2 points under your belt. Not worth holding longer until there is a definite trend in place. :D

At the moment we have a double top, and a double bottom, and she's umming and ahhhing as to which she is going to obey. Women and their indecisions, eh? LOL
 
Well, here is my two pennys worth

This is just a what I'm seeing and I am no expert.
 

Attachments

  • dow 5min33.png
    dow 5min33.png
    25.1 KB · Views: 299
What a yucky bar

I assume all the bears wacked it down in the area of the double
top. Probably would have made the mere mortals in us **** a few bricks if you know what I mean.
 

Attachments

  • dow 5min34.png
    dow 5min34.png
    22.9 KB · Views: 267
Yes - the NQmini was easier to trade prior to the US opening whereupon it wobbled all over the place.

It can trend up or down in "boxes -consolidation platforms" but at 1537 ish it dropped well below the up box at 1414 down to 1412 then went north again thro 1414 ish. 1412 popped up again around1457hours as a double bottom.

No harm done if you dont use tight stops.
 
Stoploss.

The "Wots going on `ere" bar indicates a fight between bulls and bears and supply and demand.

Hope this helps.
:)
 
That spike was news - Philly Fed announcement. But if you notice, the 3rd bar before in the chart above was a hammer (yes, I know, candlesticks!), and then the two bars before the news had higher lows, and the news spike had a higher low. So you would theoretically be long well before the news. That's how you trade news, and those who stay out of the market are just scaredy custards!
 
Todays prematket patterns

Hi

Just had a quick look at the ES. Posting a 15 and 60 minute chart.
This time without possible direction as I do not think it is really appropriate.

Cheers
Andy
 

Attachments

  • dow 5min36.png
    dow 5min36.png
    29.7 KB · Views: 387
Seeing how popular this thread is becoming, can someone restart it on Monday titled "ES Intraday this week" ...........
 
Chartman

I understand were you are coming from but on purely personal level, this thread has helped me develop my trading style from one reliant on derived indicators to using raw price and volume data. Furthermore, the interaction with Skim on this thread has been extremely important for me and others.

As such, it is a bit of a voyage of discovery for many people and I think changing its name now will mean it will loose a some of its essence.

I hope you understand where I am coming from.

Kind regards
Andy
 
Stoploss:

I find it much better to ignore the overnight trades in the patterns; they are almost two separate markets. Just keep to the regular market hours charts and you may find it easier.

Yesterday was chop suey to start with, and as I've said before, if there is sideways action in the morning, then you often get a trend over lunchtime. So use the morning's sideways chop to prepare your supper, so that you don't miss any of the trends. :D

I've annotated yesterday's 10 minute ES chart, and this is how, in an ideal world, you would trade the chop:

A on the 5 min chart this was a mini double bottom (see my previous posting of this chart). So you would be going long, up until B

B on the 5 min chart this was a mini double top (again, shown in the chart above). So at this point you would be expecting the price to go down until C

C at this point it is on support, and points A and C form a double bottom, so therefore you would be going long, until D

D at this point it is at resistance with point B. Points B and D form a double top, so you would be going short, until E

E this is actually the right shoulder of an inverted head & shoulders formed by points A, C and E.

So you need agility and lack of thought to trade chop - and much, much easier in hindsight of course.

The A,C,E points were actually easier to see on the Dow, IMO.

Once A,C,E had formed a bottom pattern, the price was ready to trend, which it did. And the rest was easy peasy to trade. :D

Note the positions of the dojis - the longer the timeframe, the more reliable they are to trade. So while they are often useless on the 5 min, they often work well on the 10 min.

Here's the chart:
 

Attachments

  • es 10 min 16 oct.jpg
    es 10 min 16 oct.jpg
    53.5 KB · Views: 367
Thing is, StopLoss, that the title conveys no particular message as to the threads' content.... Also , as a weekly thread, it can be retrieved from an archive as a series, instead of one enourmous single thread. This would also assist someone in producing a weekly digest, as Newron Bomb does for the DOW. This thread is a very important piece of work......
 
Wow, if only I could trade like that. I had a good look at the 10 minute chart yesterday and can see its advantages.

Will see if I can spot the trades in real time. It is quite satisfying getting rid of all the indicators and looking at just the basic chart.

Do I need volume for the Dow? I can't get it without changing data providers.
 
Top