Skim, what do you think of this?

Yes, yes, and yes. The stop position is purely personal, but one point will keep you safe when stops are gunned.

Do you also notice that the formation you've just posted is also a double bottom on the 5 min chart?
 
Actually I did not. You mean 4 GMT on the 14/10. I should make a note of keep looking to the left of the chart.

Skim

Today has been SPLENDID. Not sure about your short gapping entry but that will come later. I don't need to catch every bus and there were enough points to be taken today even without that one.

Thanks again Skim. You have been class.
 
* Just remember that the market is a woman, *

is that why people are always talking about riding the market ?


* which is why it's always so dangerous to have one opinion set in your mind - empty mind, going with the market's flow. *

yes , obvious but still won't stop the market doing what it wants.
 
Something interesting happened on volume during the last big drop - each volume bar increased over the previous one.

Only big boys can turn the market. Each 10 minute price bar dropped, and the volume increased. Each volume bar had a small increase over the previous one. However, the last one had a larger increase than all the others - this is the clue that the trend was ending. All those volume bars were predominantly longs, and therefore the price had no alternative but to rise.

If there is one large volume bar and the trend continues, then it will take an even larger volume bar to halt the trend.
 

Attachments

  • es 10 min 15 oct.jpg
    es 10 min 15 oct.jpg
    53.6 KB · Views: 429
Funny day - I've actually realised that all day I didnt trade a single TA pattern, as such, and just traded off price. Nothing else. No MA's. No indicators. Purely price. I only realised when I've just looked back at the days' charts now, and appreciated my different perspective. Feel a bit like a penny has dropped somewhere.
 
Here is the double bottom on the 5 min chart, and we ended with a double top. So no guesses as to what will happen tomorrow morning. :D

Do remember that today was an EASY day. As easy as they come, but not every day is like today.
 

Attachments

  • es 5 min 15 oct.jpg
    es 5 min 15 oct.jpg
    36.7 KB · Views: 422
Skim - "All those volume bars were predominantly longs" Surely for every buyer there has to be a seller. At the 10.30 am reversal the volume showed a different pattern.
 
If anything a few more days like yesterday would be good for the old learning curve. It made me think more. All I am doing right now is marking peaks and troths and looking for weakness in the trend. Once I find it, I try and view it only through price. It definitley makes more sense than all those indicators as the data is raw and undiluted. I suppose it's a case of what suits you at the end of the day, other traders make a good living by using indicators. What ever floats your boat I suppose.

Rossored

Just price, volume and S&R. Well done mate. I hope to join you soon.
 
Last edited:
According to Pring

" A selling climax involves the liquidation by most of all the weak holder. As a result, any additional bad news will be unlikely to attract significant amounts of selling. Consequently, a market that can take bearish news in its stride, indicates a strong technical position".

So basically, there was no one left to short so the market turned.
 
Skimbleshanks, My first post on T2W although I've been browsing for a few weeks. I'm fairly new to index trading although have invested in UK equities for many years. Have spent the last 6 months learning about charting following a visit to a City Index seminar. I've had some beginners luck intraday trading the S+P,
looking for obvious fib retracements and double tops/bottoms etc using only a candle chart and no indicators, so I was particularly interested when i came across this thread the other day.
I would be really grateful if you could tell me a bit more about the methods you use. I notice that all your charts are bars and wondered if you ever use candle charts.
Thanks in advance,
hampy
 
Lambchops:

I never bother with the theory of who's buying and who's selling - it's just too complicated. I was told, but I've forgotten what it is.

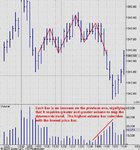
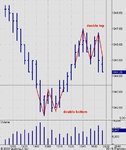
The 10:20 bottom is the same, actually, but it does look different. Volume patterns are different at the start of the day; these are often the setups which determine the rest of the day.

The 9:30 and 10:00 bars were shorts - bars this size often, but not always, indicate that the day will be a 'down' day. There's volume sufficient to turn a market, and volume which adds fuel to the trend. Those first two big volume bars just added fuel to the trend, and they may have been held until the Bond market shut at 15:00, which also coincided with the turn.

So ignoring those two bars because they signify a different timescale trade, the 10:20 bar is bigger than the previous bars. That is the little clue.

So, although it is difficult to explain, it's the same setup. But that is getting into the nitty gritty of volume, and only experience will give you that attention to detail and be able to interpret it.

Rossored:

Welcome to the Dark Side. :cheesy: And congratulations on your trades.

I just hope that I've opened your eyes to what is there, but few can be bothered to look for it. Virtually everything I've shown you was taught by Manning on one of his free 3 hour sessions which he ran from 1999 to 2001 - thousands of people attended, but virtually none of them will have realised the value of what they were shown.

There's an awful lot more to learn, but that can only happen when you've mastered the basics, and that takes time - your time. Please don't think you've sussed it all, but just look at it as a different road to travel on your trading journey, and you've only just started on this particular road.

You will probably need to teach yourself the rest - you will do this by watching, noticing things, and be surprised that they keep happening. Self-taught is best, and even if you go back to using some indicators, you'll now be far more aware of price than you ever were before.

And every time someone posts a chart which is smothered with coloured wiggly lines and lit up like a Christmas tree, you'll be peering between all the baubles and tinsel to see the price. :cheesy:

Stoploss:

Keep plodding away at it - you're on the right lines, and what you are in fact doing is learning the turns and swings of the market, so that you will eventually be able to 'feel' the movement, and trade accordingly.
 
Hampy:

Welcome to T2W. :D

I use bars because I'm predominantly interested in the high and low points, and these are difficult to see on candles. If you look at a candle on a chart, you actually see the black or white 'body' first, and then your eye goes to the wicks. If you look at a bar you see it in its entirety from top to bottom. Hence my use of bars.

Most of my stuff is scattered over these boards unfortunately, but a lot of it is in this thread.

Neil:

Great. Now you've spoilt the surprise. And don't think I'm knitting you another one. :cheesy:
 
* which is why it's always so dangerous to have one opinion set in your mind - empty mind, going with the market's flow. *


actually , I have second thoughts about this . if you don't have a preconceived plan / strategy then you tend to set yourself up for being whipsawed X times a day . could be very expensive .

in my view better to have a plan with a SL , then if your are right you are right and wrong you are wrong.

certainty is 9/10's of success.
 
Hi all - I'm new to this thread and in a different time zone (in more ways than one!) as I'm in NZ, but am really impressed with this site and the indices threads in particular especially this and the Dow thread. I have been trading the ASX200 and the Dow using D4F using mainly pattern recognition combined with S/R. I have no other data and am continually frustrated with what CMC supply. Can anyone let me know how to trade the DOW or ES with another platform which may also provide real time data - or a combination of the two. Any help would be greatly appreciated. I'm a newbie to full time trading but keen to learn and the approach on this site seems to fit!
Cheers
Quercus
 
Running again

Hi Skim.

Sorry, chumping at the bit again. Re your comment.

"The 9:30 and 10:00 bars were shorts - bars this size often, but not always, indicate that the day will be a 'down' day."

I have been reading up on volume and understand the text book
theory but just wondering if in practice, it does not always pan out. Can you please have a quick look see if I am reading this correctly.

Ta
Andy
 

Attachments

  • dow 5min31.png
    dow 5min31.png
    27.7 KB · Views: 325
This is for everyone.

For support and resistance, I have marked yesterdays high and yesterdays low together with the pivots made at market turning points.

Does that sound about right. Also, I have a pivot point calculator. Do these things work. I am hearing some good things about them from traders based out in the US. It would be interesting to hear your views.

Cheers
Andy
 
Pre market analysis

Hi

Are we all seeing the same things or are they just squiggly lines.
 

Attachments

  • dow 5min32.png
    dow 5min32.png
    25.8 KB · Views: 326
stoploss

I dont look at them very often, but todays premarket shows a turning point on the pivot line.

They seem to mark s/r "zones" reasonably consistantly. Like anything in TA they all work some of the time.
If you use esignal just have it plot them and then do an eyeball back through the charts to make an initial impression for yourself.
Am not too keen on them but i know people who swear by them.
 

Attachments

  • snapshot-5.png
    snapshot-5.png
    48.8 KB · Views: 315
Skim - I traded the FTSE 100 today on D4F and went short at 4365. In the next 30 minutes 5 of the next 6 bars dropped to 4364, and no lower, and then bounced a little bit. These are all D4F prices. On my screen I have the 5 minute FTSE and DOW. The DOW price shot up so I closed for +1 thinking the FTSE would follow and because the price hadn`t broken 'support' for half an hour. The price then dropped as soon as I had sold and punished my impatience. Do you look at other markets that might lead the ES or just the ES when trading and do you give a trade a set amount of time to play out?
P.S. I do have charts for the 'actual' index to help me check support and resistance areas.
 
Last edited:
Top