stoploss please
Established member
- Messages
- 780
- Likes
- 10
Yucky yucky
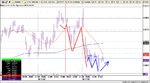
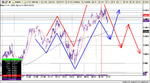
I have been trying to find this bottom all afternoon but every time I think I have got it, I get whipped out (academically). I need to keep counting those LHs and LLS.
Andy
Keep repeating to yourself, " A trend is in place until the weight of the evidence points otherwise". Or something like that.
Rossored,
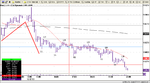
Nice short but I thought you would hit it on the break of 3 and not 2. Tighter SL.
I have not had readybrek for ages. Do you still get that orange glow or is that Sunny Delight.
Lambchops
Thanks for the complement mate.
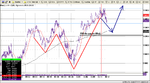
I have been trying to find this bottom all afternoon but every time I think I have got it, I get whipped out (academically). I need to keep counting those LHs and LLS.
Andy
Keep repeating to yourself, " A trend is in place until the weight of the evidence points otherwise". Or something like that.
Rossored,
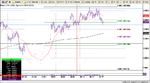
Nice short but I thought you would hit it on the break of 3 and not 2. Tighter SL.
I have not had readybrek for ages. Do you still get that orange glow or is that Sunny Delight.
Lambchops
Thanks for the complement mate.